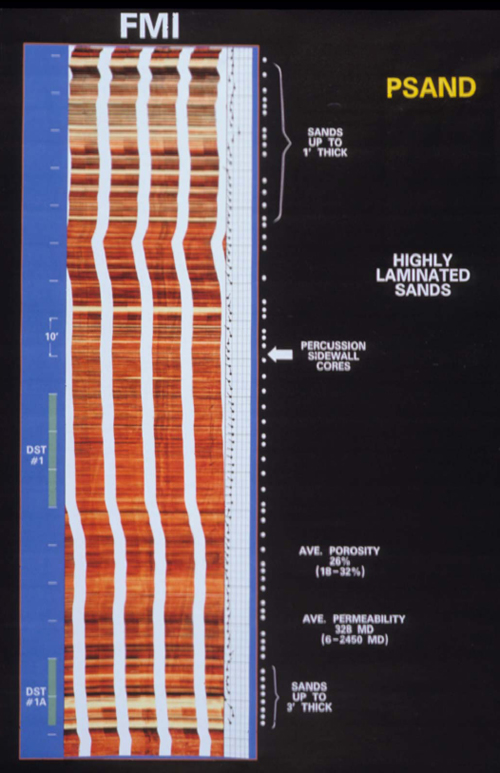
Figure 21. FMI images of the P sand interval with the location of percussion sidewall cores (shown in Figure 26) and dips. The scale is 10 ft. The average core porosity is 26% (ranging from 18 to 33%), and permeability is 32% millidarcies (ranging up to 2.5 darcies). The sands at the base are up to 3 ft thick; there is an extensive section of very finely laminated sands, with thicker sand beds at the top. The P sand was deposited in deepwater, and the dip changes indicate multiple episodes of sedimentation. The sequence is probably composed of channels and levee deposits with a thick interval of rippled silt and sand.