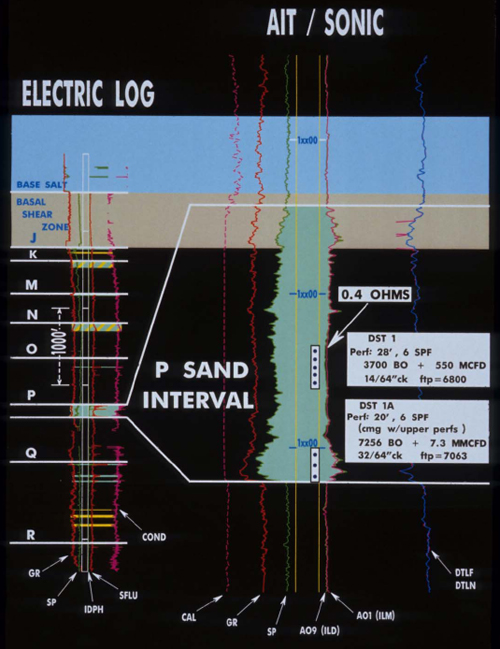
Figure 17. Well log of the P sand target interval, which was flow tested by DST 1 and DST 1A. DST 1 from perforated 28 ft flowed 3700 BO and 550MCFD on a 14/64” choke at 6800 PSI flowing tubing pressure. Perforations from the base of the sand were then added and the commingled flow rate was 7256 BO and 7.3MMCFD on a 32/64” choke at 7063 PSI flowing tubing pressure. The selective test (DST 1) was across a very low resistivity interval where sensitivities are actually lower than the shales above and below the P sand (0.4 ohms). The lower DST interval has a more typical log response that indicates pay. The total perforated interval was 48 ft out of about 200 ft gross interval.