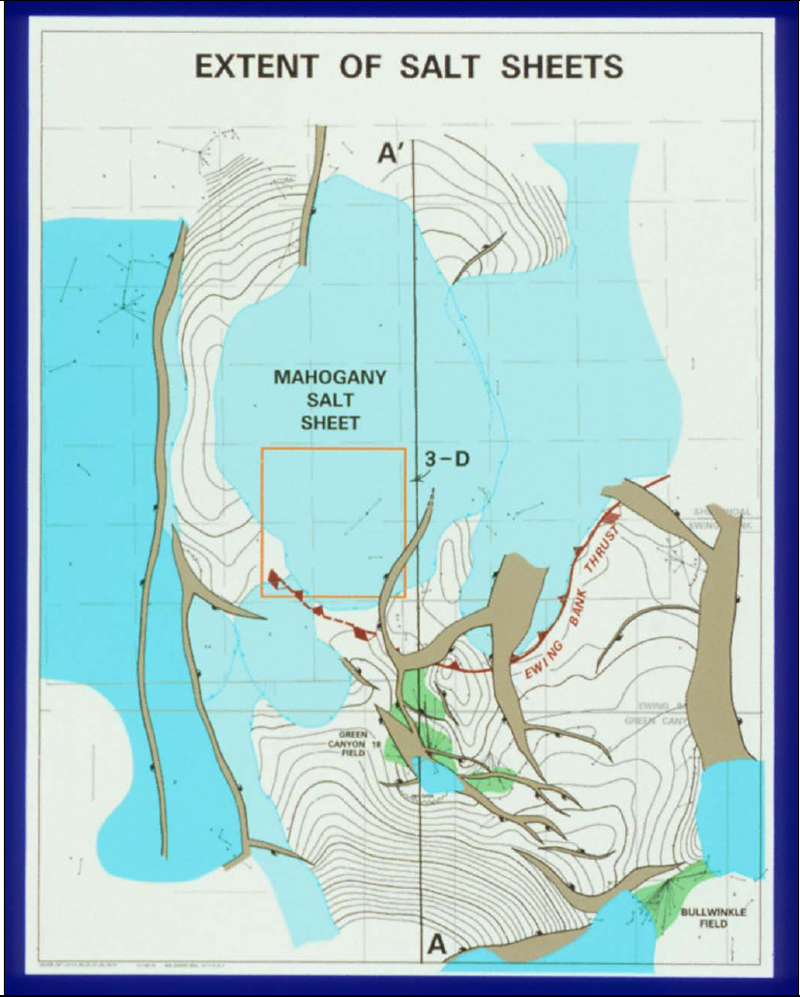
Figure 3. Map showing extent of salt sheets and the Ewing Bank thrust, which runs the leading edge of the eastern salt sheet. Seismic line A-A’ is a north-south 2-D line. Although some wells on top of the sheets had oil and gas shows, these are no significant accumulations above salt. To date (1995), the Mahogany salt sheet has four penetrations, more than any salt sheet in the Gulf. The Ewing Bank thrust is an interesting structural feature.