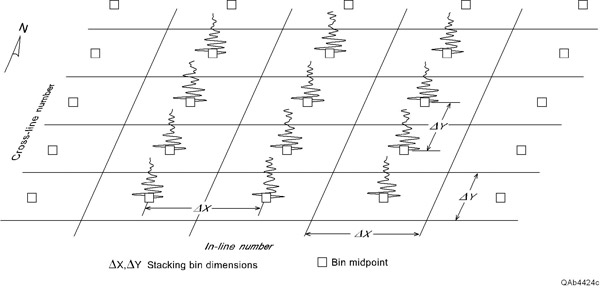
Figure 2. The area spanned by a 3-D seismic image is divided into a grid of small, abutted subareas called stacking bins. In this illustration, each stacking bin has lateral dimensions Δx and Δy. At the conclusion of 3-D data processing, a single seismic trace passes vertically through the midpoint of each stacking bin. The horizontal separations between adjacent processed traces in a 3-D data volume are Δx and Δy, the same distances as the dimensions of the stacking bins. The term in-line used here is defined as the direction that receiver cables are deployed, which is north-south in this example. In-line coordinates thus increase from west to east. Cross-line refers to the direction that is perpendicular to the orientation of receiver cables; thus cross-line coordinates increase from south to north.