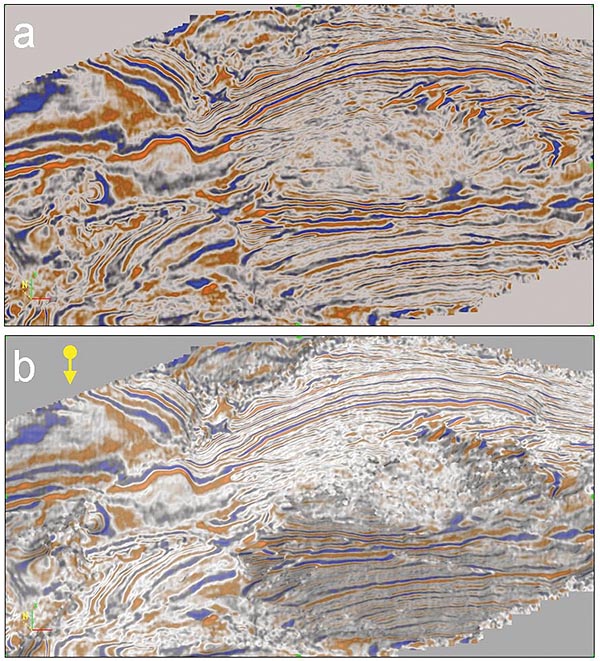
Figure 3. (a) Time slice through the seismic data volume of Figure 1; (b) the same time slice blended with shaded relief.
The yellow arrow indicates the direction of illumination. The anticlinal structure stands out sharply, even though the
crest is obscured by a gas cloud.