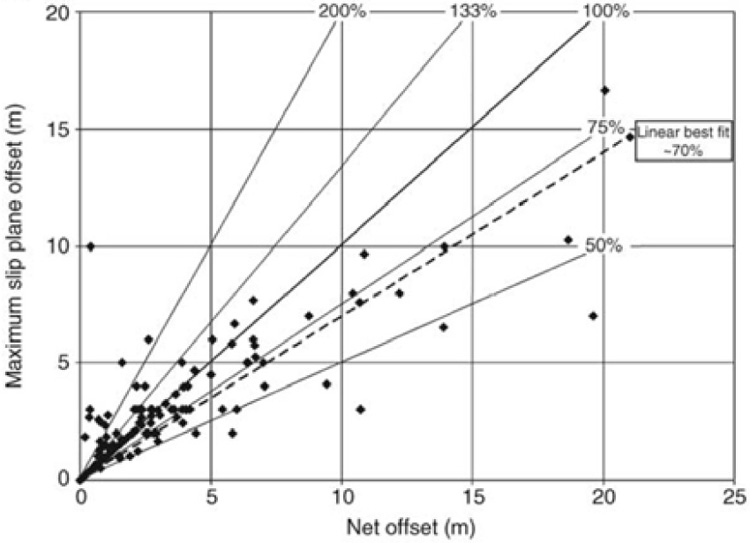
Figure 3. Graph showing the relationship between the throw seen on the maximum slip surface within a fault zone and the net throw
seen on all of the faults within the damage zone. The graph shows that the main slip surface typically accommodates ~70% of the
throw of the zone. Data from faults historically mined in the Midlands Carboniferous coalfields (Freeman et al., 2008a).