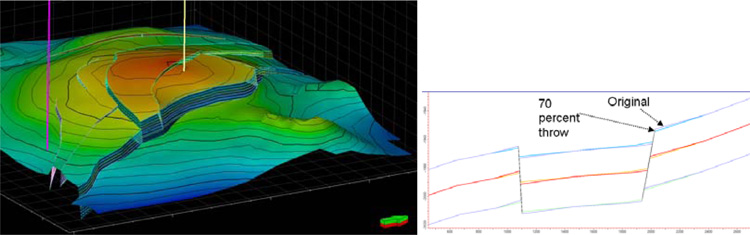
Figure 2. Geocellular model before and after throw modification (30% throw reduction applied to all faults). Left: Grid showing the
modified throw model in solid and the original model as lines along the faults. The purple line shows the position of the water injector
used in the later simulation runs and the yellow the position of the producer. The section on the right shows the minor but important
difference in form of the geometry between the original and the 70% throw case.