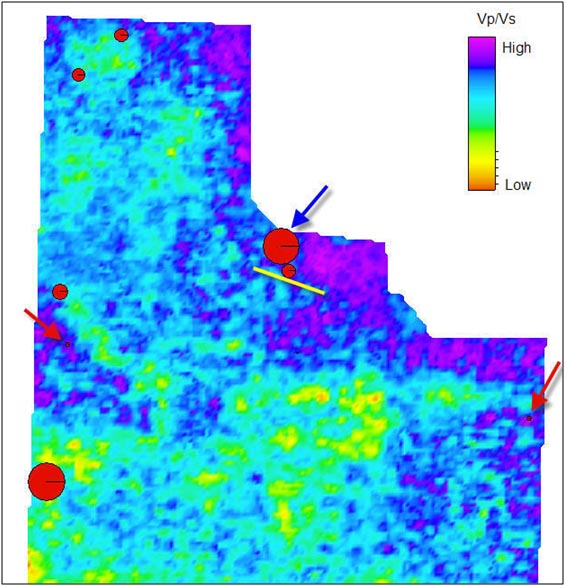
Figure 4: Map of median Vp/Vs ratio and porosity-height from 8 wells through the Lower Doig and Upper Montney. The red arrows highlight wells with very small porosity-height values and correspond in general to areas of higher Vp/Vs ratio. The blue arrow highlights a well with a large porosity-height at the edge of the seismic data where the inversion is adversely affected by decreased fold. The yellow line is the approximate location of a horizontal well where micro-seismic data were recorded.