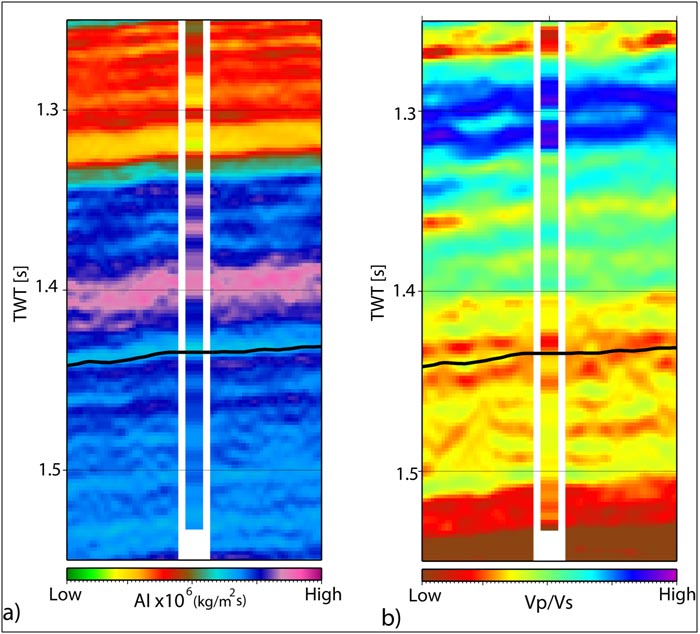
Figure 3: Pseudocolour a) acoustic impedance, and b) Vp/Vs ratio logs inserted into their respective inversion volumes. The zone of interest is illustrated by the bold dark horizon at ~1.425 s TWT.
Figure 3: Pseudocolour a) acoustic impedance, and b) Vp/Vs ratio logs inserted into their respective inversion volumes. The zone of interest is illustrated by the bold dark horizon at ~1.425 s TWT.