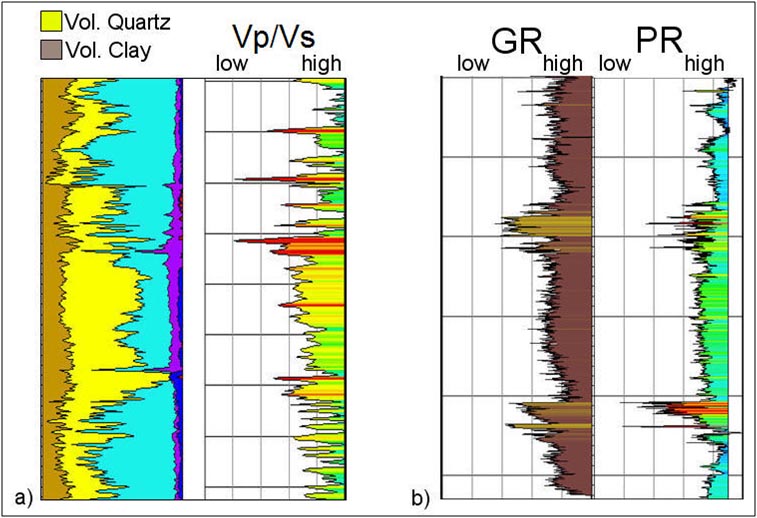
Figure 1: Log data that illustrate the correlation between low Vp/Vs ratio and/or Poisson’s Ratio (PR) with increased sand-shale content, from a) a Western Canadian shale gas play, and b) a South Texas tight gas play where low gamma ray (GR) is taken as a proxy for increased quartz content.