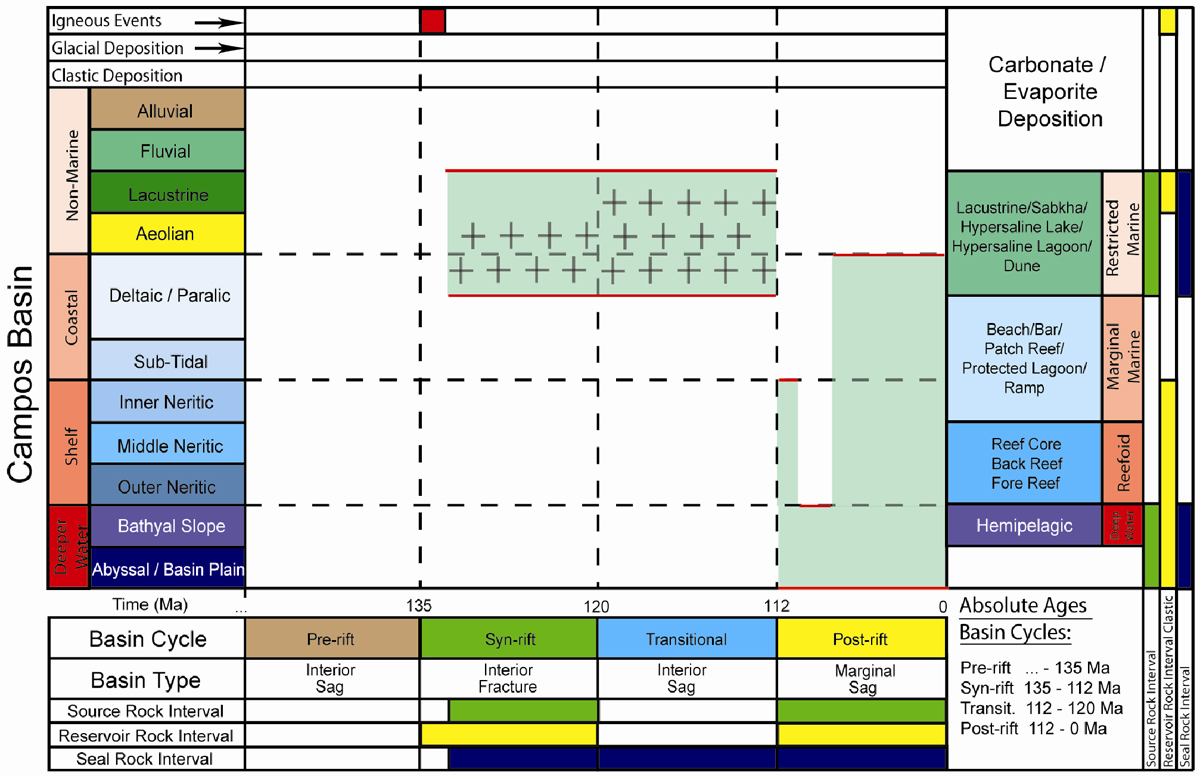
Figure 3. Example “Trajectory Plot” for the Campos Basin, which describes the sedimentary evolution (vertical axis) versus basin cycle evolution (horizontal axis): The absolute ages of the basin cycles are shown, as well as the cycle and depositional environment of the source, reservoir, and seal horizons identified. The plus signs indicate a restricted (hypersaline) marine depositional environment.