Click to view article in PDF format.
GCDim Spots in Seismic Images as Hydrocarbon Indicators*
Alistair R. Brown1
Search and Discovery Article #40514 (2010)
Posted March 12, 2010
*Adapted from the Geophysical Corner column, prepared by the author, in AAPG Explorer, February, 2010, and entitled “Good News: A Dim Future Isn't Bad”. Editor of Geophysical Corner is Bob A. Hardage ([email protected]). Managing Editor of AAPG Explorer is Vern Stefanic; Larry Nation is Communications Director.
1 Consultant, Allen, Texas ([email protected])
Everyone has heard of a ![]() bright
bright![]() spot – a high seismic amplitude caused by hydrocarbon. Much oil and gas has been found by drilling anomalous
spot – a high seismic amplitude caused by hydrocarbon. Much oil and gas has been found by drilling anomalous ![]() bright
bright![]() reflections, particularly in younger sediments. But how many explorationists have found hydrocarbon with dim spots – a reduction in amplitude caused by hydrocarbon? When water in a porous rock is replaced by hydrocarbon, the acoustic impedance (the product of density and velocity) of the rock universally reduces in magnitude. The effect diminishes with depth, but the change is always in the same direction – a decrease in impedance. The observed seismic phenomenon depends on the impedance of the reservoir, and on the magnitude of the impedance change, relative to the impedance of the embedding rock.
reflections, particularly in younger sediments. But how many explorationists have found hydrocarbon with dim spots – a reduction in amplitude caused by hydrocarbon? When water in a porous rock is replaced by hydrocarbon, the acoustic impedance (the product of density and velocity) of the rock universally reduces in magnitude. The effect diminishes with depth, but the change is always in the same direction – a decrease in impedance. The observed seismic phenomenon depends on the impedance of the reservoir, and on the magnitude of the impedance change, relative to the impedance of the embedding rock.
|
|
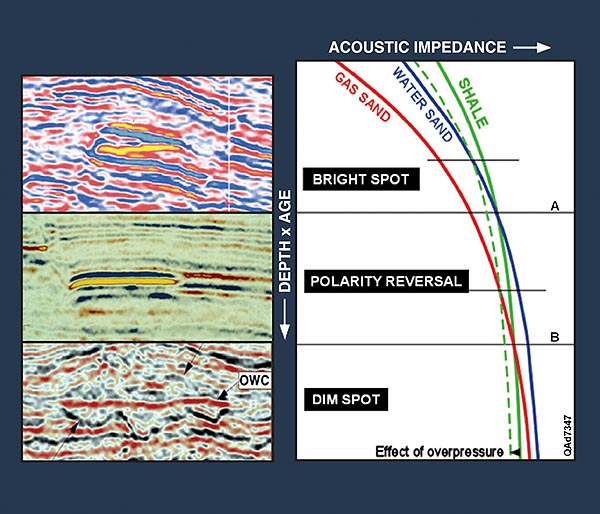
Compaction of sand and shale causes their acoustic impedances to increase with depth and age (Figure 1), but these impedances normally increase at different rates. For young, shallow clastic rocks, sands typically have lower impedance than shales – but for older, deeper clastic rocks, sands typically have higher impedance than shales. Note the crossover of the shale impedance and sand impedance curves on the figure.
When a water sand has lower impedance than its embedding shale, changing the water in the pores to hydrocarbon increases the sand-shale impedance contrast and thus increases seismic reflection amplitude, which results in a
Figure 1 shows normal compaction curves for one local area. Because these are trends generally applicable to many areas, no numbers are assigned to the axes. The crossovers of the curves cause the phenomena
Notice on Figure 1 there is a data example illustrating each of the seismic reflection phenomena. The dim spot example illustrates a strong oil-water contact reflection, but the reflection from the top of the oil sand is low amplitude and difficult to see because it is a dim spot. The above argument means that dim spots occur deeper than
An interpreter must consider all the characteristics of hydrocarbon reflections, not just dimness (or brightness), and in AAPG Memoir 42 (sixth edition) the author lists 17 characteristics observable on seismic data that are properly displayed on a workstation. In addition there are special techniques like AVO and converted waves that provide additional evidence. We all know that the easiest oil and gas has been found and that future exploration challenges must involve innovative technological applications and smarter explorationists. Dim spots are thus an opportunity of the future, and the emerging generation of geoscientists should accept the challenge. The future of direct observation of hydrocarbons may be dim indeed! Brown, Alistar R., 2004, Reservoir Identification, AAPG Memoir 42 and SEG Investigations in Geophysics, No. 9, Chapter 5, p. 153-197.
Copyright © AAPG. Serial rights given by author. For all other rights contact author directly. |