Click image to view enlargement.
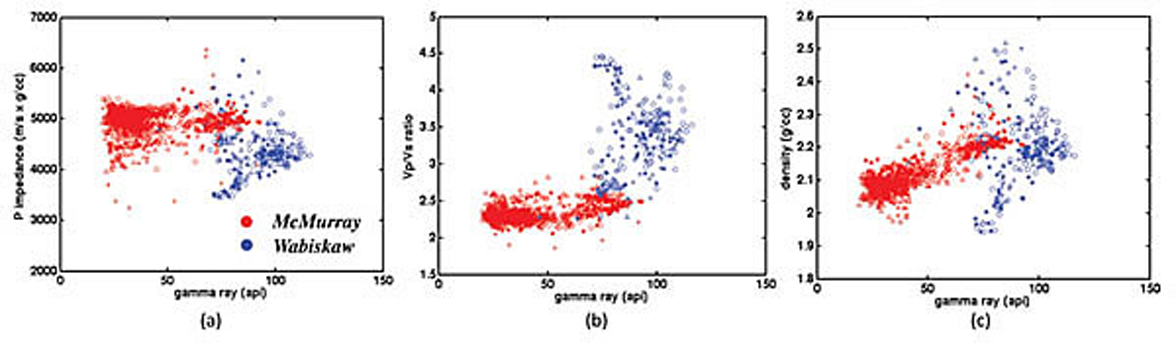
Figure 1. Cross-plots of gamma-ray versus (a) P-impedance, (b) Vp/Vs velocity ratios and (c) density. Red
samples are from the McMurray Formation and blue samples are from theWabiskaw Formation. Note that bulk
density and gamma-ray responses (c) increase in a quasi-linear manner.