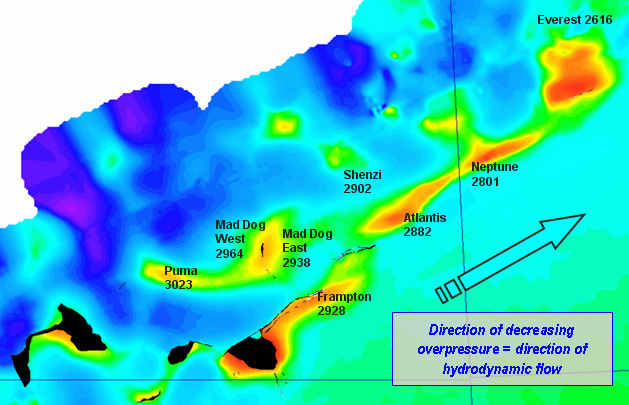
Figure 1. Potentiometric map showing degree of overpressure (relative to hydrostatic) versus location (modified after Moore et al., 2001).
Figure 1. Potentiometric map showing degree of overpressure (relative to hydrostatic) versus location (modified after Moore et al., 2001).