Print this page
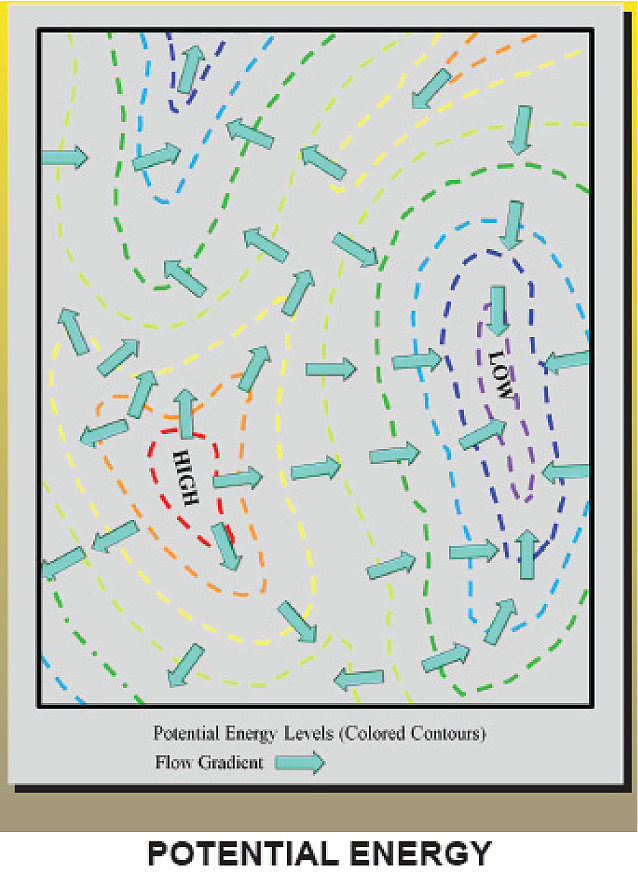
Figure 15. Map of contours reflecting levels of potential energy from high (Red) to low (Violet).