![]() Click to view poster in PDF format.
Click to view poster in PDF format.
PSRole of Natural Fracturing in Production from the Bakken Formation, Williston Basin, North Dakota*
Stephen D. Sturm1 and Ernest Gomez1
Search and Discovery Article #50199 (2009)
Posted August 28, 2009
* Adapted from poster presentation at AAPG Annual Convention and Exhibition, Denver, Colorado, USA, June 7-10, 2009.
1Schlumberger Data and Consulting Services, Greenwood Village, CO. ([email protected])
The Mississippian - Devonian Bakken Formation is a restricted - shallow water mixed carbonate – clastic sequence deposited over most of the Williston Basin. It consists of three members; Lower (dark marine shale with a high organic content), Middle (mixed carbonates and clastics) and Upper (dark marine shale with a high organic content). The Middle Member is the main reservoir unit, although in North Dakota it is characterized by low porosities (<8%) and permeabilities (<0.1 mD). Bakken production was first established from the Middle Bakken in the 1950s at Antelope Field, a fault bounded anticline located at the south end of the Nesson Anticline. The high initial rates and cumulative production in this field are attributed to natural fractures. Production also occurs in fractured shales of the Upper and Lower members southwest of the Nesson Anticline. These lines of evidence along with recent rates in excess of 2000 BOPD in areas of low matrix properties have lead many to conclude that natural fractures are playing an important role in enhancing production from the Bakken. Recently released cores and image log interpretations, however, indicate that the overall fracture intensity and apertures are too small to adequately explain these high production rates. Other factors such as high pore pressure and lithology may actually be more relevant..
uBakken Research Consortium Study Area uMiddle Bakken Fracture Characterization
uBakken Research Consortium Study Area uMiddle Bakken Fracture Characterization
uBakken Research Consortium Study Area uMiddle Bakken Fracture Characterization
uBakken Research Consortium Study Area uMiddle Bakken Fracture Characterization
uBakken Research Consortium Study Area uMiddle Bakken Fracture Characterization
uBakken Research Consortium Study Area uMiddle Bakken Fracture Characterization
uBakken Research Consortium Study Area uMiddle Bakken Fracture Characterization
|
Objective
Provide an opportunity for industry leaders with governmental support to utilize the best available technologies to optimize understanding of the key factors associated with Bakken productivity – “Science Project”
Participants
Working Interest Partners: • XTO. • Continental. • Hess. • Brigham. • Encore. • Petro-Hunt. • Whiting.
Primary Technical Partner • Schlumberger.
Secondary Technical Partners • Schlumberger/Terrascience. • MicroSeismic Inc. • United States Department of Energy (DOE).
Grant Assistance • North Dakota Oil and Gas Research Council.
Development Concept
• Drill three (3), 4000’, single lateral wells close enough together to allow horizontal microseismic monitoring from the middle well. (Figure 1) • Acquire complete set of modern logging suites in the laterals including the Formation MicroImager* (FMI) for fracture characterization.
• Identify best available technologies to optimize geologic, drilling and completion practices associated with Bakken Productivity. (Figure 2) • Reduce risk, create or add asset value. • Better understand the relationship between matrix and natural fractures with regard to reservoir performance. • Characterize natural fracturing: – Lithological component. – Fracture height. – Fracture orientation. – Fracture aperture. – Relationship to mud gas logs. • Compare these findings with completion practices and production to determine effective methods to improve recovery.
• Drill 3 short lateral wells 1500’ apart using advanced drilling technologies • Target ‘Clean GR Zone’ in Middle Bakken. (Figure 3) • Evaluate Reservoir in Horizontals with: • FMI* • Sonic Scanner* • ECS* • RST* • Utilize 42X-36 well as Monitoring Well • 16 shuttles/1600’ geophones • Complete 41X-36H with Pre-perforated liner • Complete 44X-36H with 8 swell packers • Placement based on reservoir evaluation
Bakken Research Consortium Study Area
Background Information
New geologic models applied to the Bakken Formation, advances in drilling and production technologies and recent oil discoveries have resulted in these substantially larger technically recoverable oil volumes. About 105 million barrels of oil were produced from the Bakken Formation by the end of 2007. (USGS, 2008)
The Bakken Consortium Study area is located approx. 4 miles east of the Beaver Lodge Field (Nesson Anticline) in Williams County, North Dakota (Sec 36. –T156N – R95W). (Figure 4) The Manitou field area is located off the east flank if the Nesson Anticline is located in an area of minor structural curvature, and has monoclinal dip of <1.5°. (Figure 5) Compared to other areas of the Williston Basin, this area appears to have a higher potential for natural fracturing due to structural influence.
Formation MicroImager (FMI) logs were acquired in each lateral to characterize fracture attributes. (Figure 6) Lateral wells targeted the high carbonate sequence, or ‘cleanzone’ approximately 8’ below the base of the U. Bakken Shale. Because the wells (negatively or positively) exited the target zone along the lateral length, fracture statistics related to lithology (or facies) were then calculated for the Middle Bakken.
Middle Bakken Fracture Characterization
Formation MicroImager (FMI) logs were acquired on the 3 lateral wells to identify and characterize fracturing. (Figure 7, Figure 8, Figure 9, and Figure 10) Analysis of borehole image data indicates that both Natural and Induced Fracturing does occur within the Middle Bakken. (Figure 11)
Natural Fractures
• Are rare, and occur mostly in the low-GR, high CaCO3 ‘parasequence’, or the “clean-zone”. • Natural Fractures are mostly in the NW-SE orientation, or in the S_Hmin orientation. • Natural Fractures are ‘bed-bound’, with fracture height <2 ft. • Natural fractures have dips ranging from 70 – 90°. • All Natural Fractures have resistive cement along fracture faces. • Natural fractures have microdarcy to nannodarcy permeability. • Cum fracture porosity ranges from 0.0003 – 0.0005%. • No Correlation to Mud Gas.
Induced Fractures
• Occur mostly in higher stress [Young’s Modulus – Poisson’s Ratio] lithologies. • Are discontinuous, and have higher aperture on TOP and BOTTOM of borehole. • Do not exhibit any resistive cement along fracture face. • Have >80° fracture dip. • Define S_Hmax at N 45-55°E.
Natural Fracturing in Middle Bakken
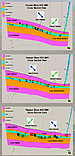
• Low-frequency fracturing is present in the Middle Bakken interval (Figure 12): – Fractures occur predominantly in the high CaCO3 ‘parasequence’ in the upper Middle Bakken. – Fractures are bed-bound, limited to the height of thin-beds (~2’). – Vertical fracture connectivity is poor. (Figure 13) • Fracture spacing (between fractures) is variable: – From 39’ à 144’ in “target-zone”. – From 87’ à 266’ along lateral length. – Fractures are relatively non-existent in the lower Middle Bakken dolomitic rocks: • Laterals placed in this zone will drill faster, and not encounter natural fractures. • Fracture orientation is bi-modal in the Consortium wells: – NW-SE striking fractures are dominant. – NE-SW striking extension fractures in-line with S_Hmax are subordinate. • Fracture planes dip in opposed directions from 60 à 90° (mean > 80°). • Fractures are partially-filled with carbonate cement: – Fracture aperture is in the nannodarcy range. – Cumulative fracture porosity is 0.0003 à 0.0005%. • There is NO CORRELATION of FRACTURES TO MUD GAS: – Increase in mud gas is typically observed at the toe of the laterals. (Figure 14)
|