 |
|
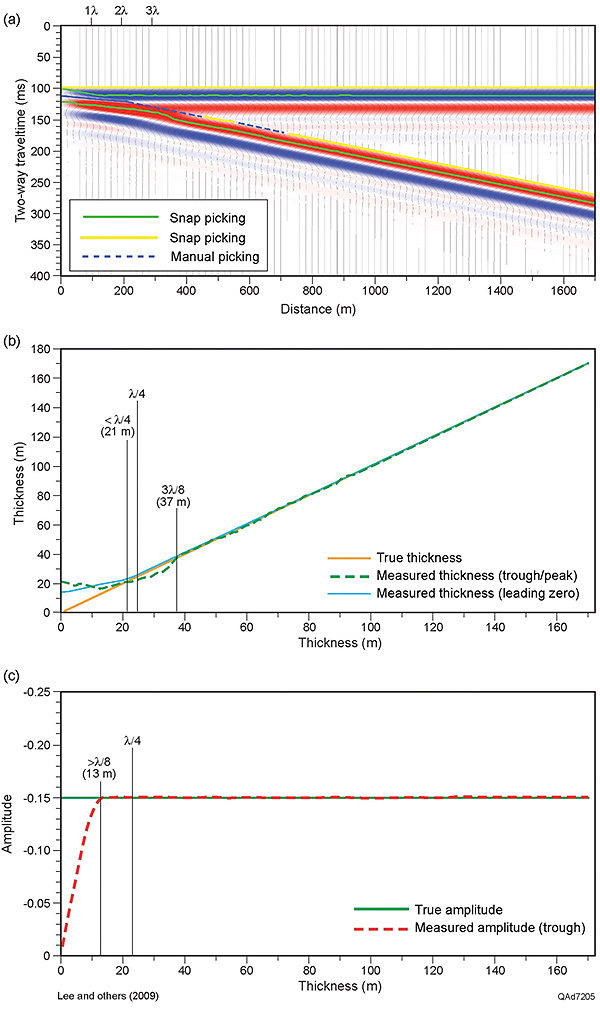
Figure 4. (a) Synthetic seismic section when the wedge model is illuminated with the minimum-phase Ormsby wavelet. The top and base of the wedge were picked by snapping to the leading zero amplitude (solid yellow horizon) and also to the leading trough and leading peak (solid green horizon). Manual picking was used for the base of the wedge (dashed horizon) where snap picking became erratic due to tuning effect. The lateral dimension of the wedge in units of the wavelength (λ) of the Ormsby wavelet is marked on the top of the section; (b) Tuning curve for bed thickness and (c) for amplitude. The tuning thickness from the leading zero crossing (dashed blue line) and the trough/peak picking (green line) are both about 21 m, but the errors in the tuning vicinity for the trough/peak picking are larger than those from the zero-phase Ormsby wavelet. There are no tuning amplitude maxima.