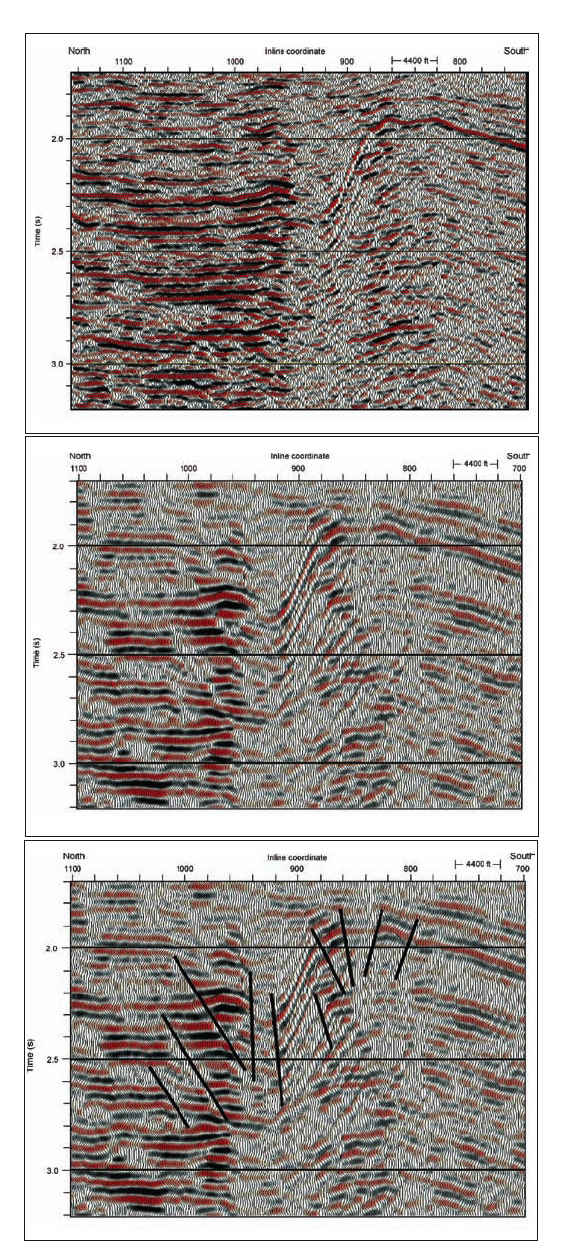
Figure 2. Data example 2: (top) Image utilizing the full frequency range (8 to 80 Hz) of the illuminating wavefield; (middle) Image when the frequency content is restricted to the first octave (8 to 16 Hz). This fault system is better seen with the data that are constrained to the lowest frequency octave (bottom).