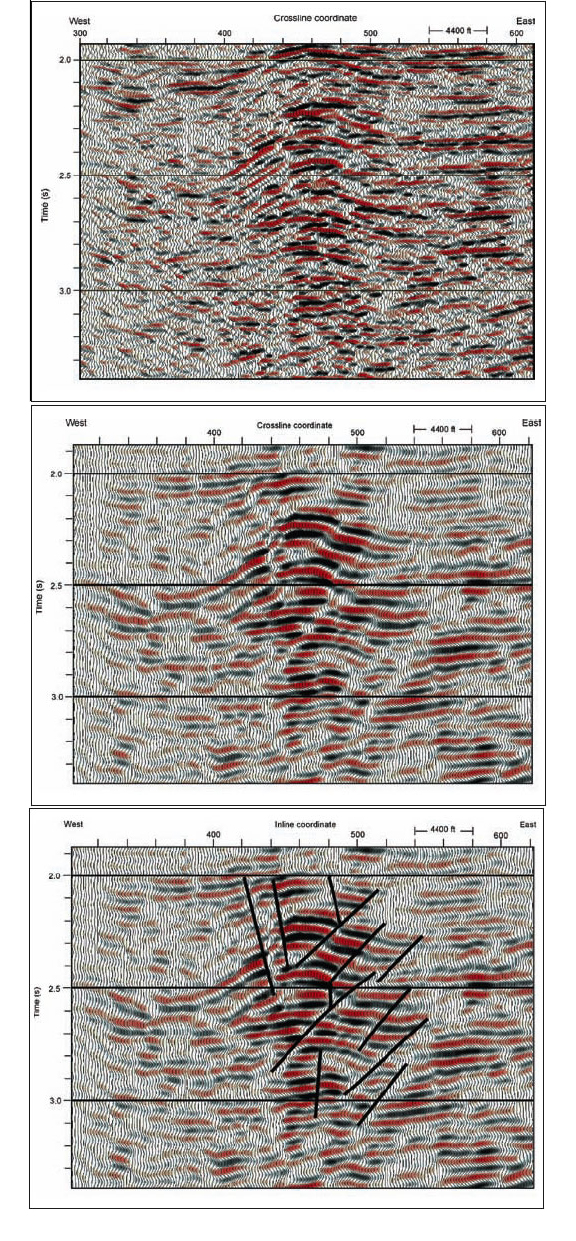
Figure 1. Data example 1: (top – panel a) Image utilizing the full frequency range (8 to 80 Hz) of the illuminating wavefield; (middle – panel b) Image when the frequency content is restricted to the first octave (8 to 16 Hz). The fault system traversed by this profile is better seen with the frequency-constrained data (bottom – panel c).