 |
|
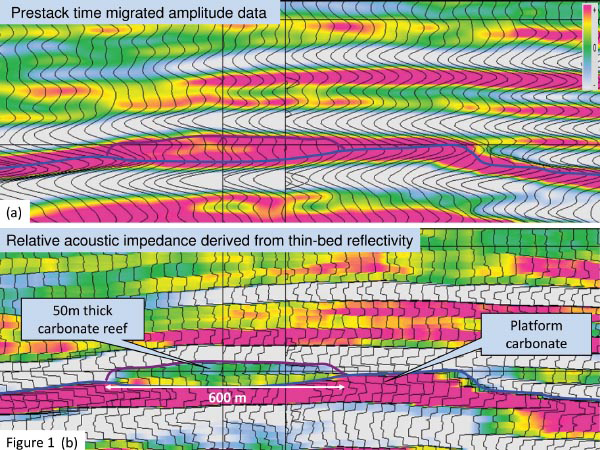
Figure 1. (a) A seismic section from a prestack time migrated data volume showing a weak signature of a gas-producing reef defined by a blue horizon (bottom of reef) and a dark purple horizon (top of reef); (b) the equivalent section shows a relative impedance determined from thin-bed reflectivity. The reef shows up clearly in terms of the green color.