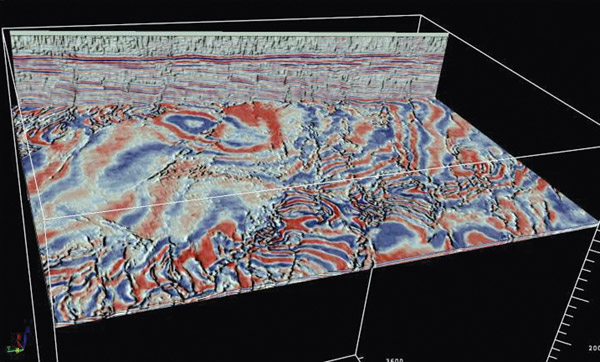
Figure 1b. Same timeslice and arbitrary line as in Figure 1a, but corendering amplitude (conventional blue-white-red color bar) and coherency attribute (black lines show reflection discontinuities). Note the improvement in fault definition compared to the conventional amplitude display.