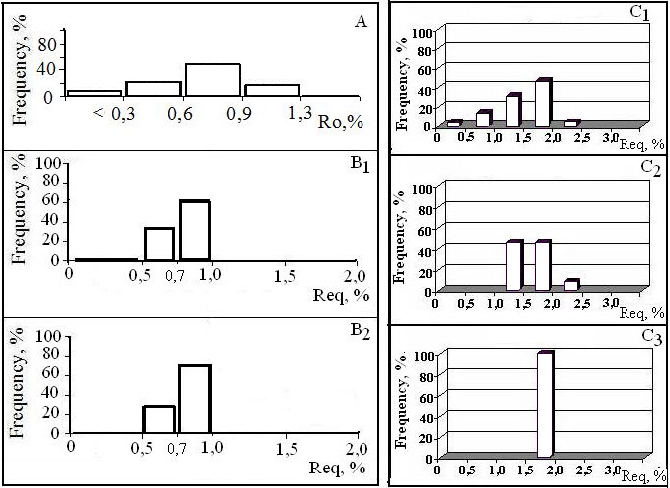
Figure 1. Histogram of distribution of the maturity values of organic matter (A), oils (B1 - petroleum fields; B2 - mud volcanoes) and HC gases (C1 - petroleum fields; C2 - mud volcanoes; C3 - gas hydrates).
Figure 1. Histogram of distribution of the maturity values of organic matter (A), oils (B1 - petroleum fields; B2 - mud volcanoes) and HC gases (C1 - petroleum fields; C2 - mud volcanoes; C3 - gas hydrates).