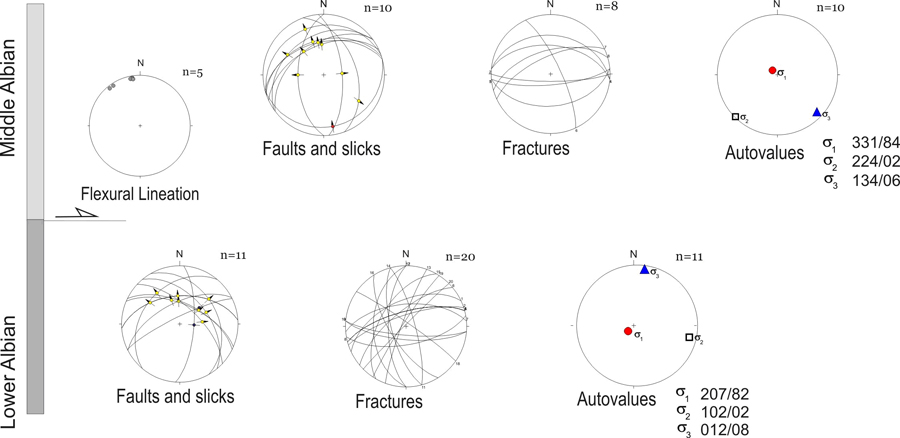
Figure 2. Stereoplots (lower hemisphere) of structures observed in the studied core and inversion of fault/slicks data. See text for further discussion.
Figure 2. Stereoplots (lower hemisphere) of structures observed in the studied core and inversion of fault/slicks data. See text for further discussion.