Click on image to view enlargement.
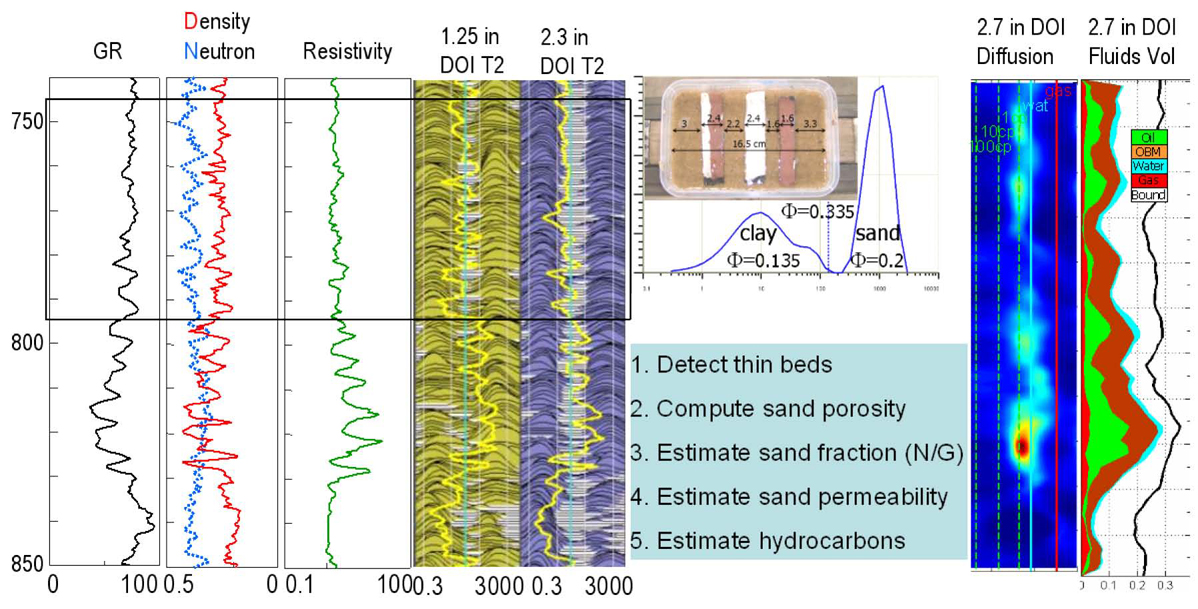
Figure 1. Laminated Sand/Shale shows the characteristics T2 bimodal distribution. The experiment shows how NMR can be used to estimate sand layers that are physically below the measurement aperture. Diffusion log shows oil in the thin beds.