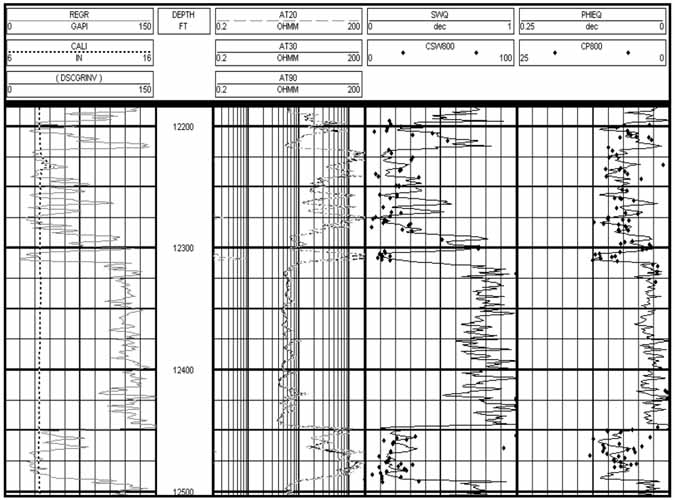
Figure 10. Log profile of gamma ray (track 1), resistivity (track 2), water saturation (track 3), and porosity (track 4). The discrete points represent the measured water saturation and porosity from the core. Note that there is close agreement between the core and log values for both water saturation and porosity.