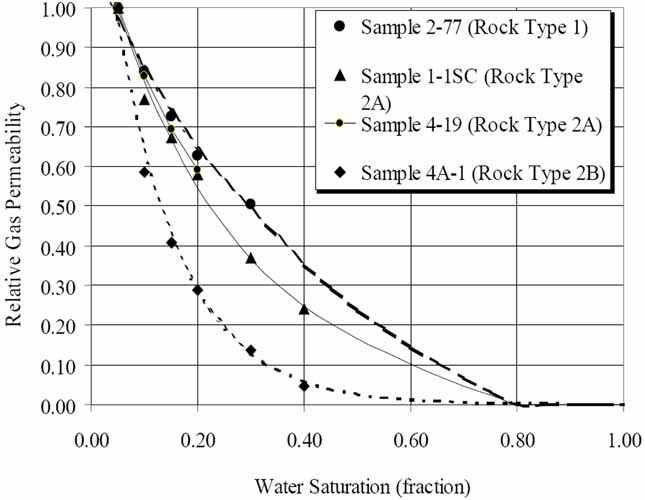
Figure 8. Relative permeability curves for hydraulic rock types 1, 2A and 2B. All curves were normalized to 5% initial water saturation based on the minimum water saturation measured in rock type 1.
Figure 8. Relative permeability curves for hydraulic rock types 1, 2A and 2B. All curves were normalized to 5% initial water saturation based on the minimum water saturation measured in rock type 1.