Print this page
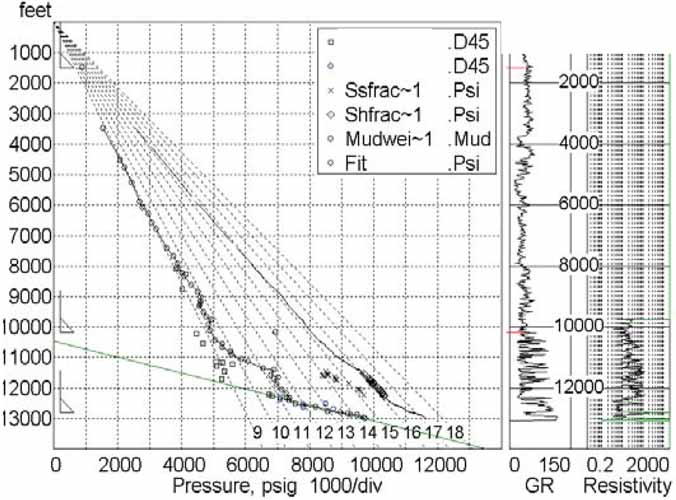
Figure 5. An example of a typical vertical pressure distribution estimated from the acoustic log response.