--> Figure 3B. The Tilt anomaly restricted to values lying between ±45°. The colour fill (proprietary GETECH method) between these contours represents the depth estimate which varies along the contours due to anomaly interference and non 2D structural effects.

Datapages, Inc.Print this page


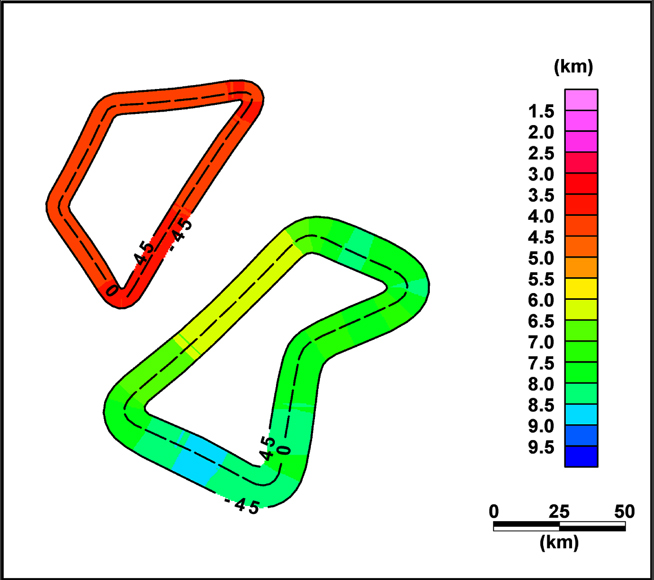
Figure 3B.The Tilt anomaly restricted to values lying between ±45°. The colour fill (proprietary GETECH method) between these contours represents the depth estimate which varies along the contours due to anomaly interference and non 2D structural effects.