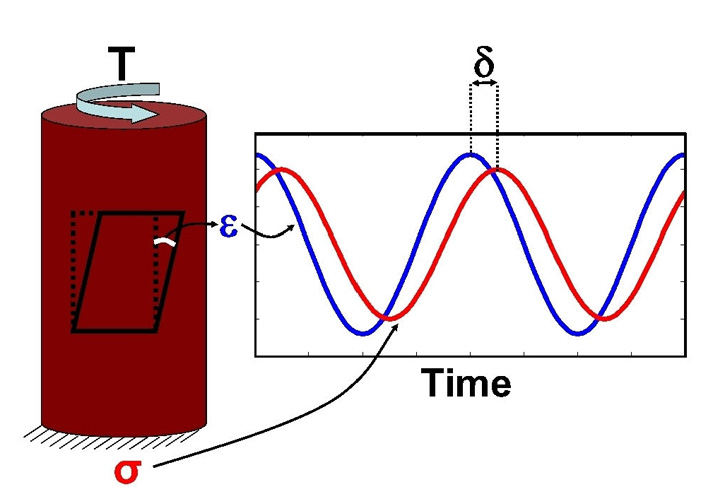
Figure 1. Schematic diagram of a harmonic loading applied to a rock sample. T denotes the torque applied to one end of the sample. The resulting stress, σ (red) lags behind the strain, ε (blue) by a phase angle δ.
Figure 1. Schematic diagram of a harmonic loading applied to a rock sample. T denotes the torque applied to one end of the sample. The resulting stress, σ (red) lags behind the strain, ε (blue) by a phase angle δ.