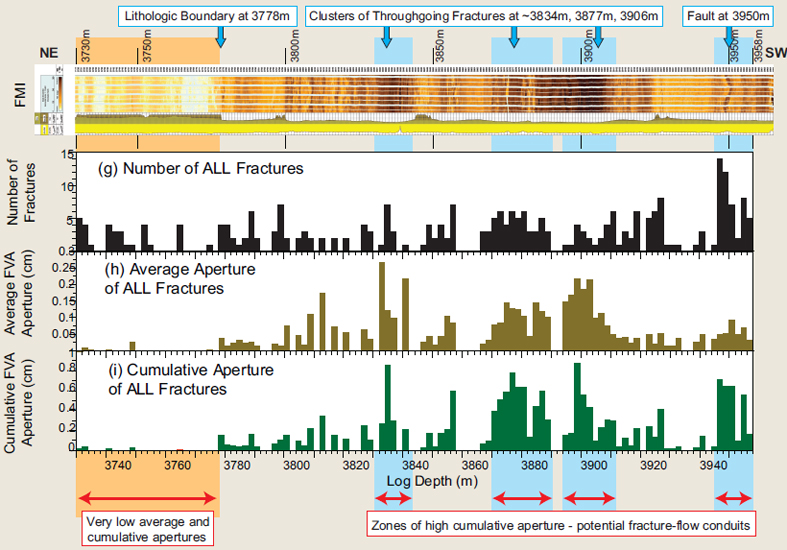
Figure 3-7(g), Figure 3-7(h), and Figure 3-7(i). Fracture apertures, lithology boundaries, and FMI log, POL-GX well. (g). Number of all fractures; (h) average aperture of all fractures; (i) cumulative aperture of all fractures. Mean and median apertures of throughgoing fractures are nearly twice as large as bed-confined fractures (Figure 3-7(d) and Figure 3-7(e)), a relationship that can also be seen in t he scatter plot (Figure 3-7(f)). Note the clustering of bed-confined fractures adjacent to throughgoing fractures (Figure 3-7(f)). Frequency plots of number of fractures (g), average fracture aperture (h), and cumulative fracture aperture (i) for 2m intervals reveal a strong dependence of aperture size on lithology and identify several potential fracture-flow zones.