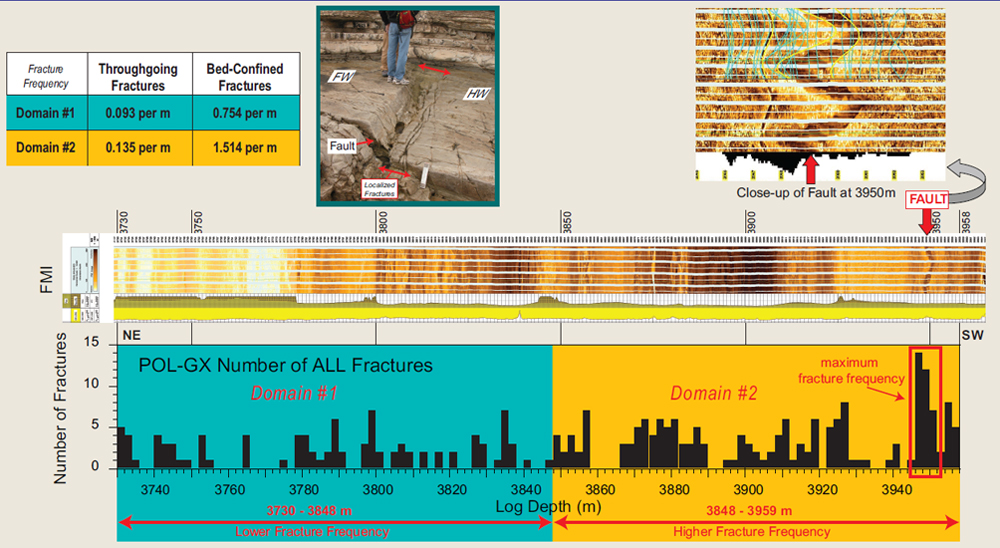
Figure 3-6. Comparison of outcrop showing fracture intensity near fault and segment of FMI log that shows major fault (upper right). Locally intense fracturing is adjacent to a small normal fault on outcrop, and the highest fracture frequency observed in the POL-GX FMI log is localized around the one large fault at a log depth of 3950m. Features of fracture domains (upper left), and histograms of each domain (lower).