--> Development Challenges in a Fracture-Enhanced Carbonate Grainstone Reservoir, Polvo Field, Brazil - from Reservoir Characterization to Dynamic Model, by Peter Schwans, T.C. Lukas, Michael Gross, Marty Cohen, D. Scott Bird, Francois Hindlet, and Kim Zauderer, #20079 (2009).

Datapages, Inc.Print this page

Click to view poster in PDF format.


PSDevelopment Challenges in a Fracture-Enhanced Carbonate Grainstone Reservoir, Polvo Field, Brazil - from Reservoir Characterization to Dynamic Model*


Peter Schwans1, T.C. Lukas2, Michael Gross2, Marty Cohen2, D. Scott Bird1, Francois Hindlet1, and Kim Zauderer1


Search and Discovery Article #20079 (2009)

Posted October 15, 2009


*Adapted from poster presentation at AAPG Annual Convention, Denver, Colorado , June 7-10, 2009. See companion article, “Application of Mechanical Stratigraphy to the Development of a Fracture-Enhanced Reservoir Model, Polvo Field, Campos Basin, Brazil”, Search and Discovery Article #20080 (2009).

1 International Exploitation, Devon Energy, Houston, TX ([email protected]).

2 Consultant – Lukas, Houston, TX ([email protected]); Gross– Department of Earth Science, Florida International University, Miami, FL ([email protected]).


Abstract

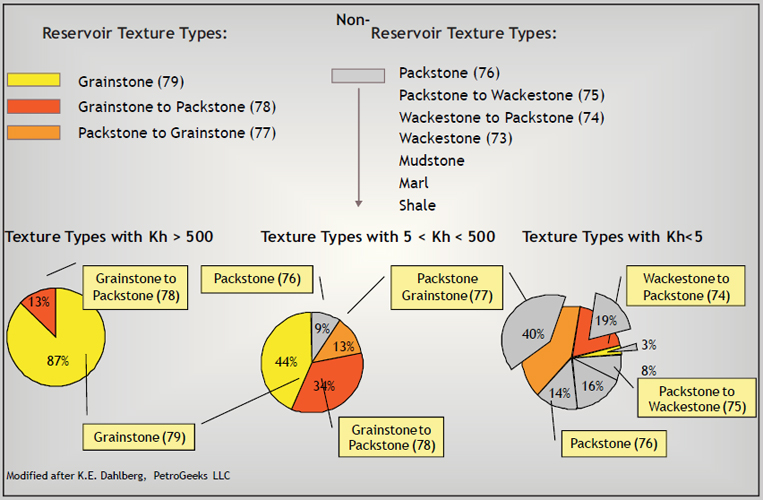
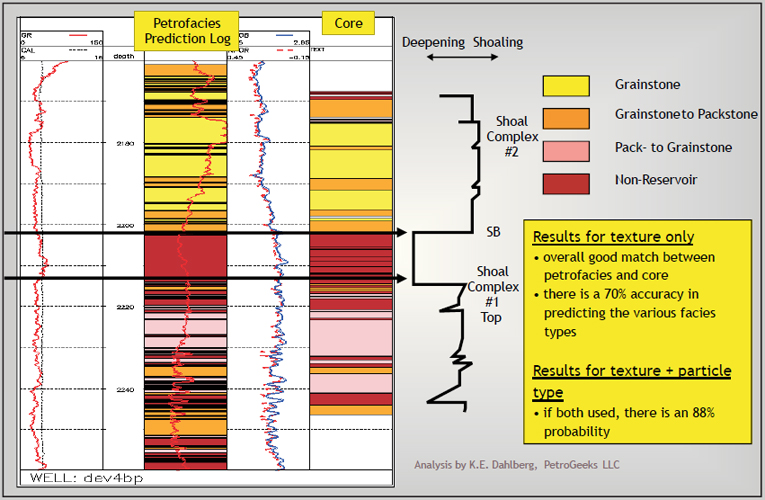
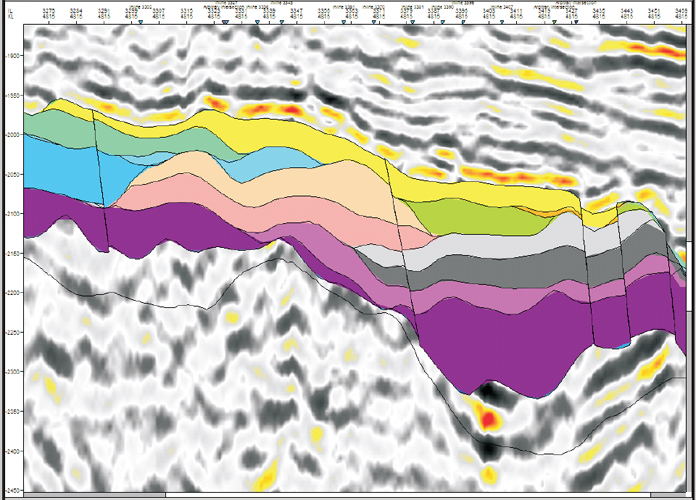
A combined fracture and matrix static and dynamic model was built for carbonate shoal sequences of Polvo Field, offshore Campos Basin, Brazil. The Albian-age carbonates of the Quissama Member (Macaé Formation) were deposited in shallow marine to intertidal, shoaling-upward sequences on a partially emergent shelf. Shoal complexes are retrogradationally stacked, probably in response to onset of drowning of the shelf in the Late Albian. They are unconformably overlain by the transgressive shales and marls of the Outeiro Member. Individual shoal sequences comprise burrowed subtidal packstones grading upward to oncolitic-oolitic grainstones often capped by hardgrounds. The carbonate sequences are often only partially preserved and stack vertically and offlap laterally in complex fashion to form three shoal complexes. Reservoir heterogeneity occurs at the facies and sequence-stratigraphic level; later diagenesis and subsequent fracturing and faulting added additional complexity.

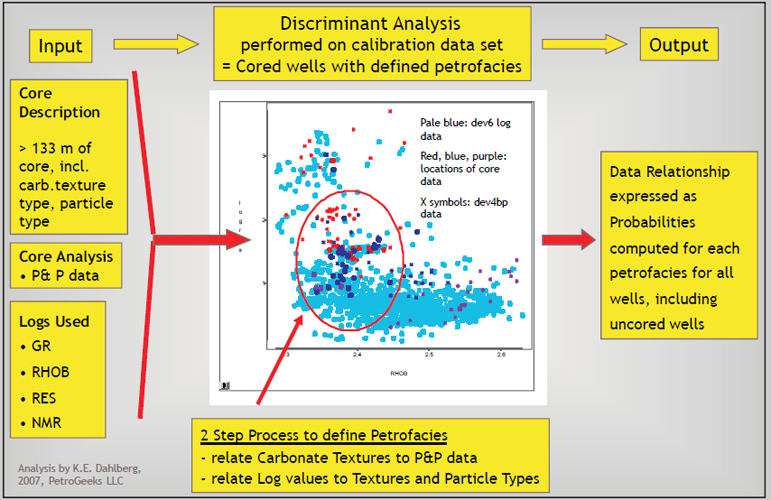
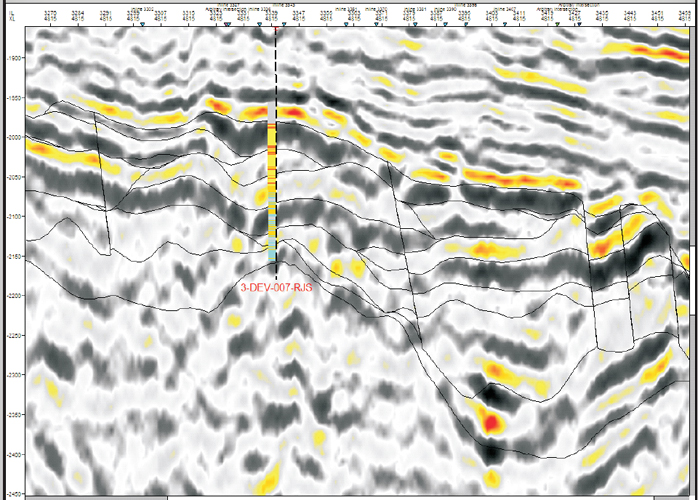
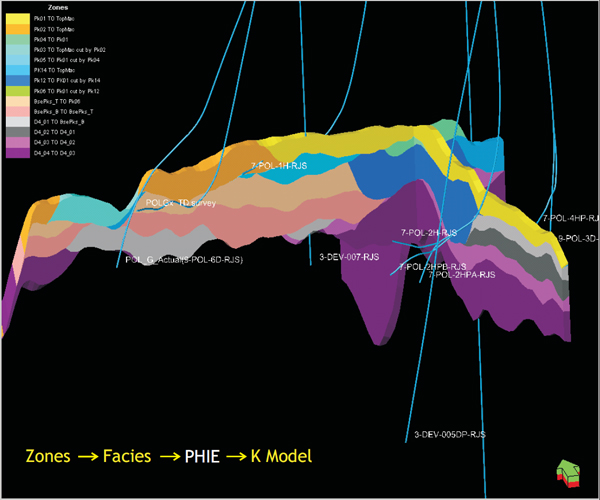
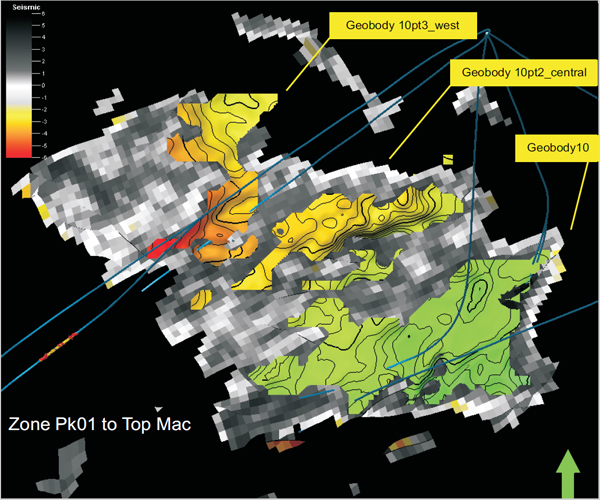
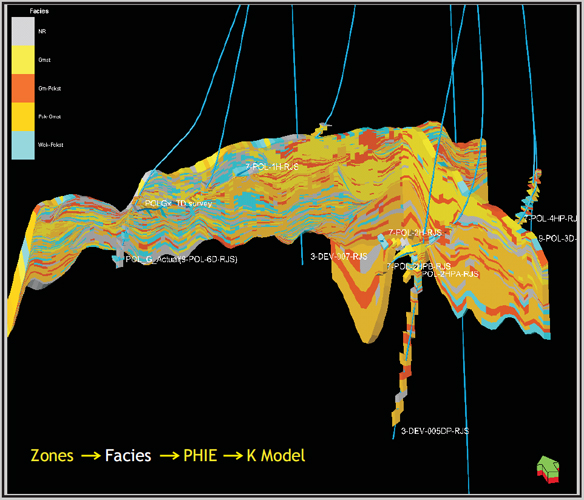
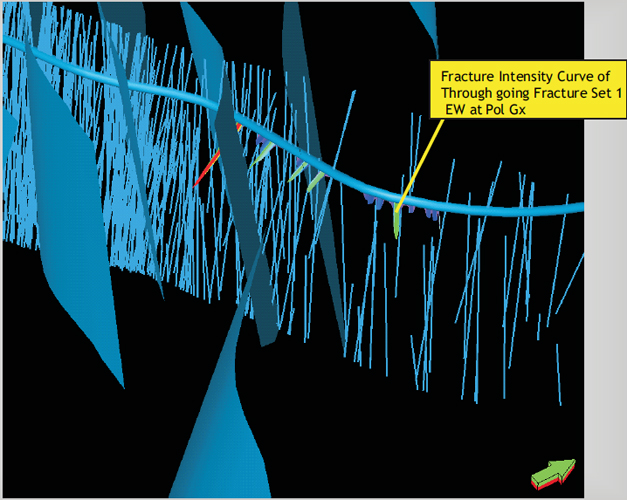
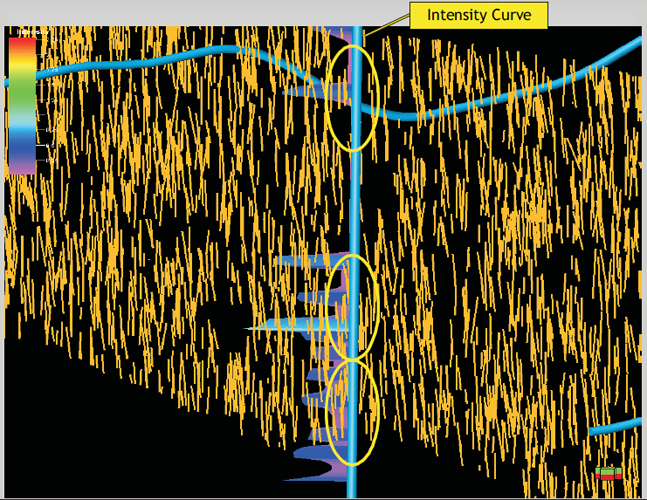
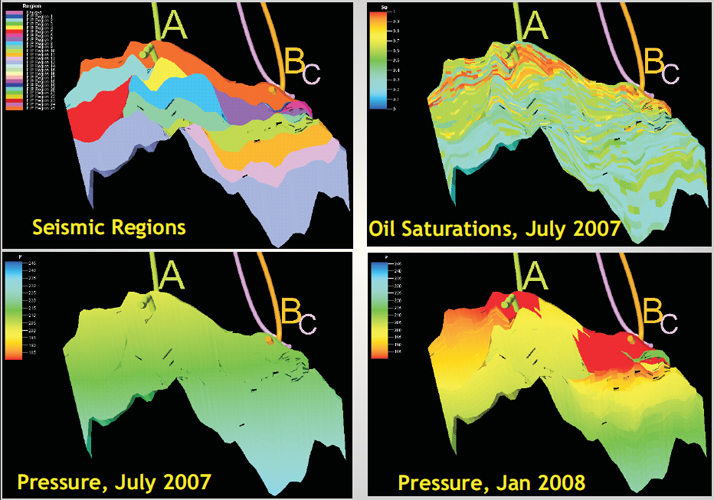
A matrix and a mechanical stratigraphy model with discrete fracture networks were built to model the dual porosity-permeability systems. In the matrix model oil saturated grainstones of the younger shoal complexes form a high permeability veneer overlying older and cemented shoal complexes with patchy matrix permeability; the latter exhibit abundant fracturing, however. Detailed core descriptions were linked to logs to define probability petrofacies and associated permeability distributions. The fracture systems are identified in cores and via FMI logs. Their distribution and character was used to define a mechanical stratigraphy and associated DFN’s. Together with seismically mapped faults, the fractures play a significant role in maintaining reservoir energy and vertical connectivity in this highly compartmentalized system where neighboring wells do not communicate. Instead, wells exhibit a high amount of reservoir energy that exceeds the amount accounted for by the mapped hydrocarbon and aquifer zones.


uAbstract

uLocation, framework

uFigures 1-1 – 1-2

uEnvironment

uFigures 1-3 – 1-7

uModel input

uFigures 1-8 – 1-12

uCarbonate model

uFigures 2-1 – 2-9

uReservoir

uFracture model

uFigures 3-1 – 3-13

uConclusions

uReferences


uAbstract

uLocation, framework

uFigures 1-1 – 1-2

uEnvironment

uFigures 1-3 – 1-7

uModel input

uFigures 1-8 – 1-12

uCarbonate model

uFigures 2-1 – 2-9

uReservoir

uFracture model

uFigures 3-1 – 3-13

uConclusions

uReferences


uAbstract

uLocation, framework

uFigures 1-1 – 1-2

uEnvironment

uFigures 1-3 – 1-7

uModel input

uFigures 1-8 – 1-12

uCarbonate model

uFigures 2-1 – 2-9

uReservoir

uFracture model

uFigures 3-1 – 3-13

uConclusions

uReferences


uAbstract

uLocation, framework

uFigures 1-1 – 1-2

uEnvironment

uFigures 1-3 – 1-7

uModel input

uFigures 1-8 – 1-12

uCarbonate model

uFigures 2-1 – 2-9

uReservoir

uFracture model

uFigures 3-1 – 3-13

uConclusions

uReferences


uAbstract

uLocation, framework

uFigures 1-1 – 1-2

uEnvironment

uFigures 1-3 – 1-7

uModel input

uFigures 1-8 – 1-12

uCarbonate model

uFigures 2-1 – 2-9

uReservoir

uFracture model

uFigures 3-1 – 3-13

uConclusions

uReferences


uAbstract

uLocation, framework

uFigures 1-1 – 1-2

uEnvironment

uFigures 1-3 – 1-7

uModel input

uFigures 1-8 – 1-12

uCarbonate model

uFigures 2-1 – 2-9

uReservoir

uFracture model

uFigures 3-1 – 3-13

uConclusions

uReferences


uAbstract

uLocation, framework

uFigures 1-1 – 1-2

uEnvironment

uFigures 1-3 – 1-7

uModel input

uFigures 1-8 – 1-12

uCarbonate model

uFigures 2-1 – 2-9

uReservoir

uFracture model

uFigures 3-1 – 3-13

uConclusions

uReferences


uAbstract

uLocation, framework

uFigures 1-1 – 1-2

uEnvironment

uFigures 1-3 – 1-7

uModel input

uFigures 1-8 – 1-12

uCarbonate model

uFigures 2-1 – 2-9

uReservoir

uFracture model

uFigures 3-1 – 3-13

uConclusions

uReferences

Location and Stratigraphic Framework
(Figures 1-1 and 1-2)

Figure 1-1. Location map of Polvo Field, offshore Campos Basin, Brazil.

Figure 1-2. Sequence stratigraphic framework and depositional events.

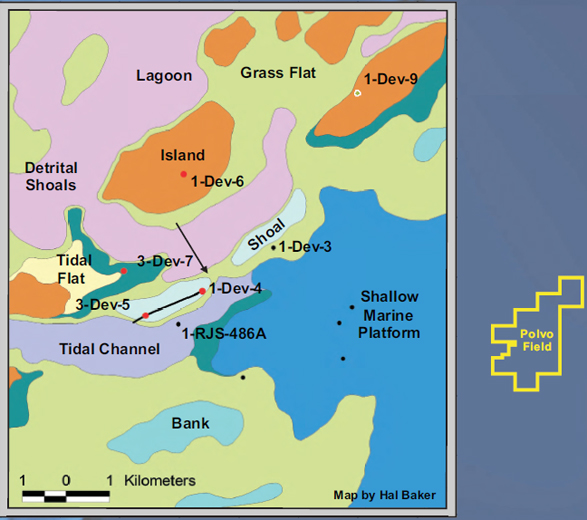
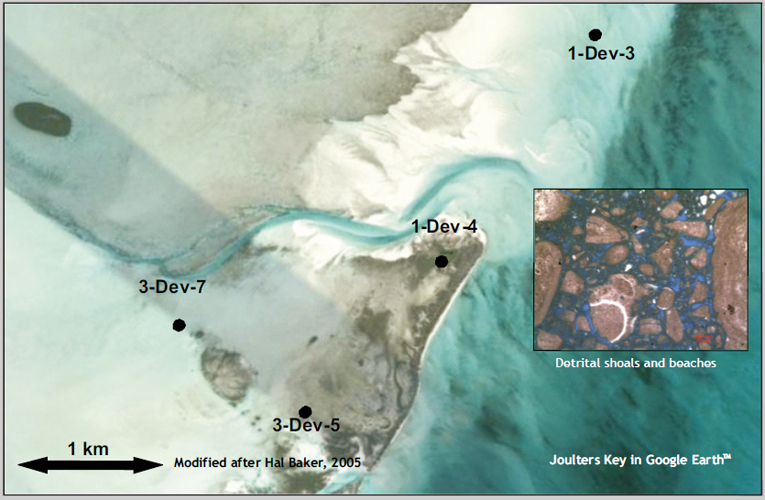
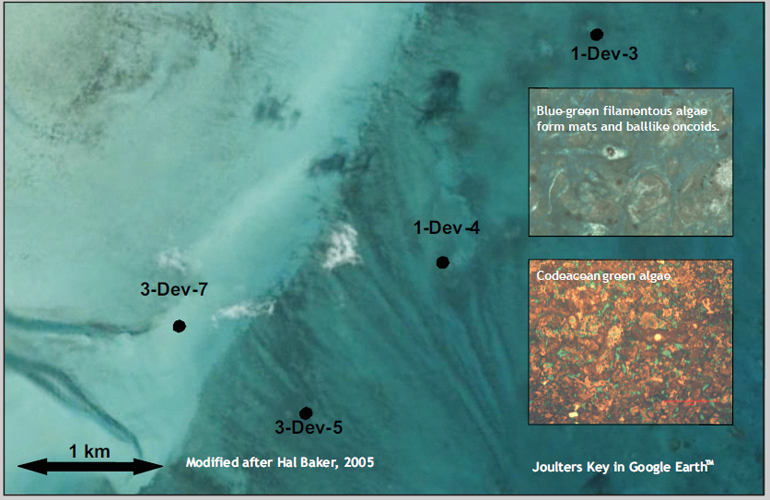
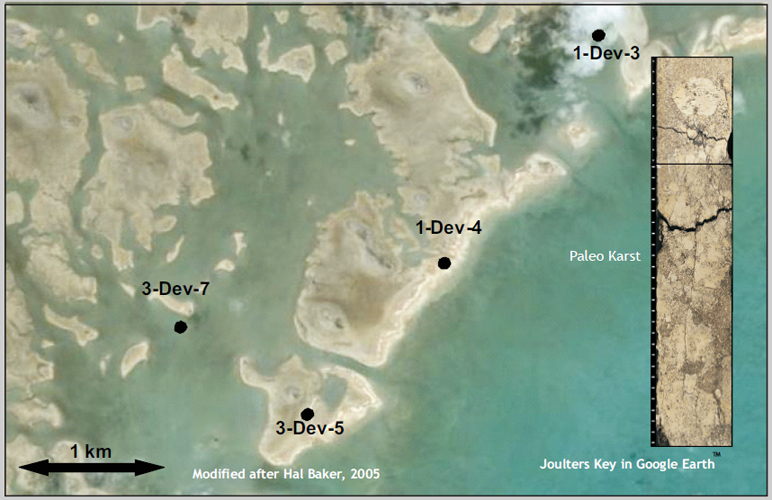
Depositional Environment and Paleogeography
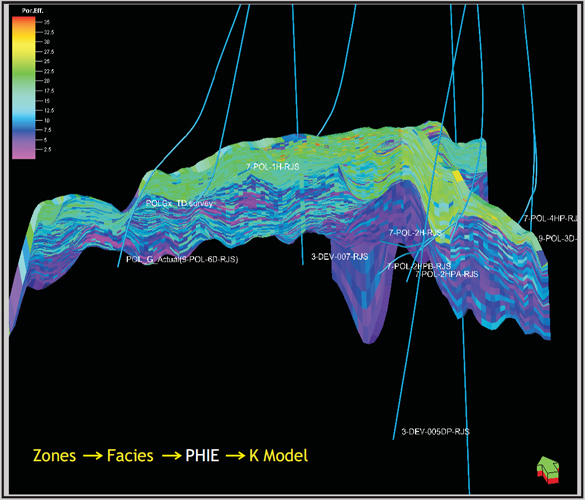
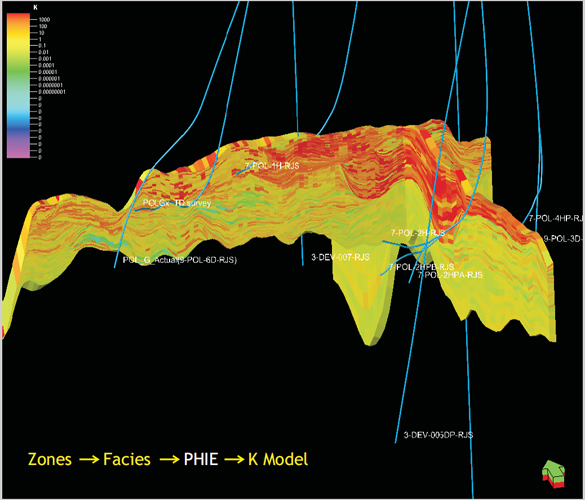
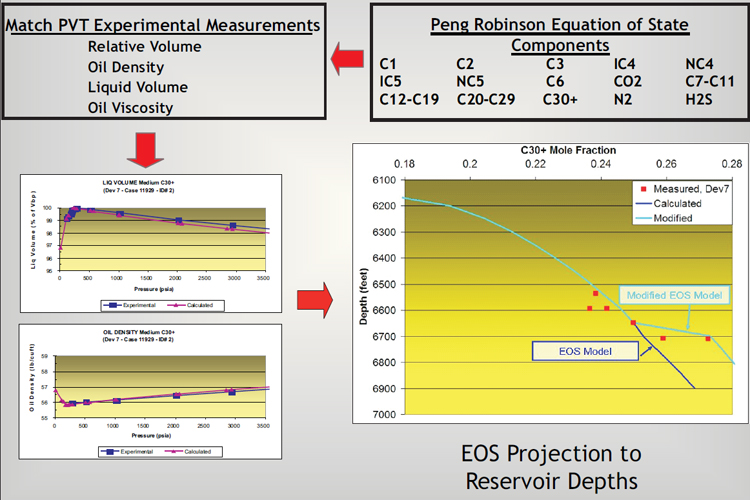
(Figures 1-3, 1-4, 1-5, 1-6, and 1-7)

Figure 1-3. Idealized paleo-facies map at late Quissama time.

Figure 1-4. Grainstone reservoirs are deposited as coastal shoals in the upper Quissama Member.

Figure 1-5. Subaerial exposure enhances reservoir porosity and permeability.

Figure 1-6. Upper Quissama shoal deposition backsteps landward, and muddy algal facies are deposited.

Figure 1-7. Late Albian subaerial exposures and shoal erosion terminates Quissama deposition. Restricted marine conditions exist throughout the area.

Matrix Model Input
(Figures 1-8, 1-9, 1-10, 1-11, and 1-12)

Figure 1-8. Modeling workflow.

Figure 1-9. Core-to-log calibration.

Figure 1-10. Textures and Phi-K relationships.

Figure 1-11. Facies probabilities vs. core.

Figure 1-12. Input data types: Summary and integration.

Carbonate Matrix Model Workflow
(Figures 2-1, 2-2, 2-3, 2-4, 2-5, 2-6, 2-7, 2-8, 2-9)

Figure 2-1. Seismic-stratigraphic framework.

Figure 2-2. Carbonate sequences.

Figure 2-3. Matrix model zones.

Figure 2-4. Carbonate geobodies.

Figure 2-5. Facies model. Facies distribution is guided by dip-azimuth data from FMI, geobodies from seismic, probability facies or petrofacies integrating core and well logs.

Figure 2-6. PHIE model. Porosity to permeability transforms are specific to carbonate texture types after Lucia (2007).

Figure 2-7. K model. Porosity to permeability transforms are specific to carbonate texture types after Lucia (2007).

Figure 2-8. Controls of faults and fractures.

Figure 2-9. Top dolomite map.

Reservoir Characteristics

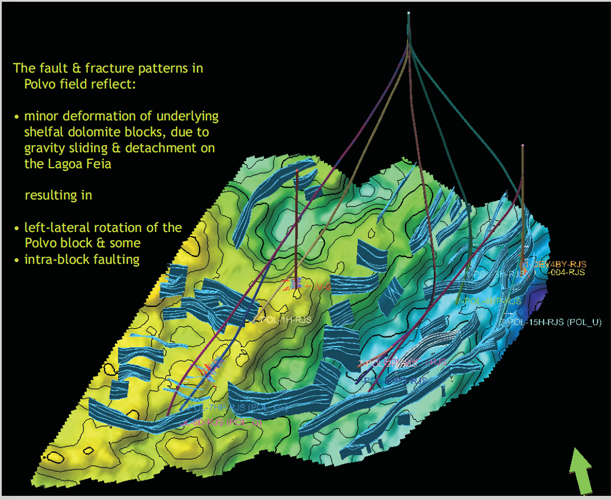
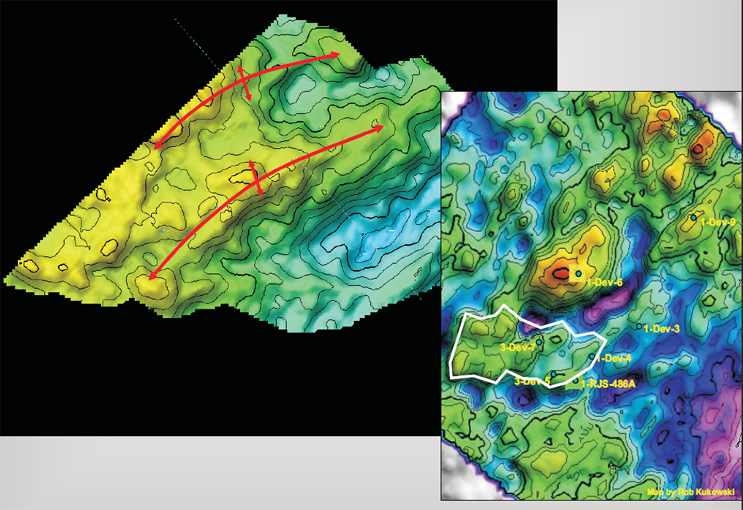
Observation in the field are:

  • Wells, although near to each other, do not communicate.
  • Well pressure data show that wells have access to a larger volume than what is available in the static model.
  • Rates and drainage areas are better than predicted from matrix alone.
  • There is no additional, unmapped volume outside the model.
  • Well pressures increase after shut-in.

This indicates that:

  • Additional volume and pressure support have to come from the large volume of rock underlying the productive zone.
  • Faults and fractures identified in cores and seismic are the most likely conduits for pressure support.
  • Fractures define some of the anisotropy.
  • Most likely a Type III Fractured Reservoir.

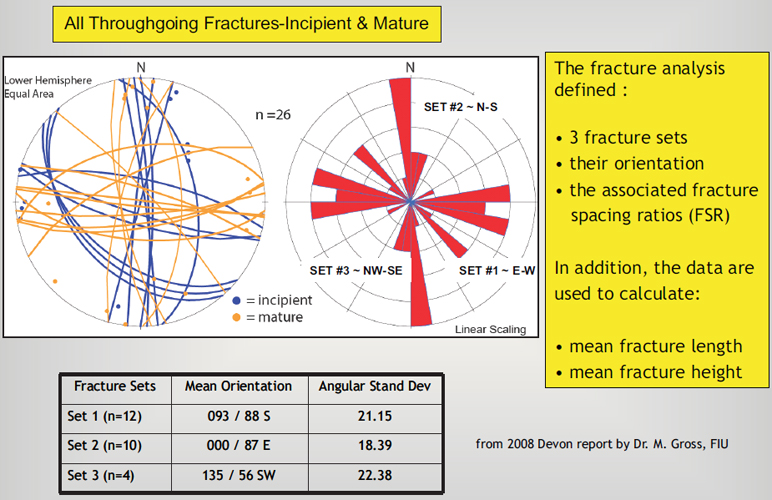
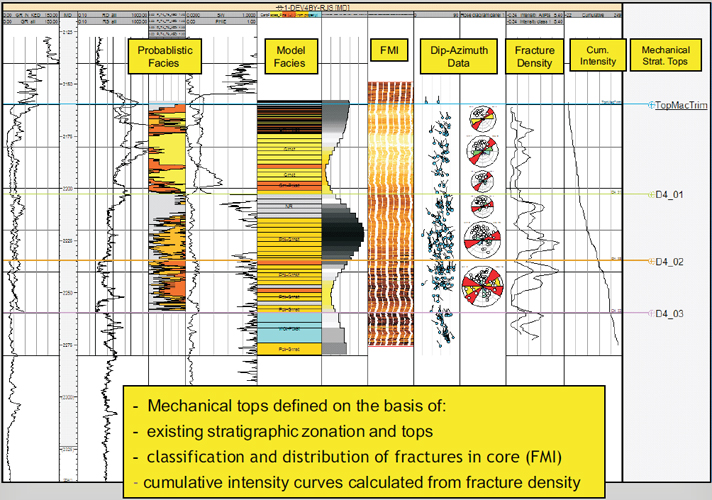
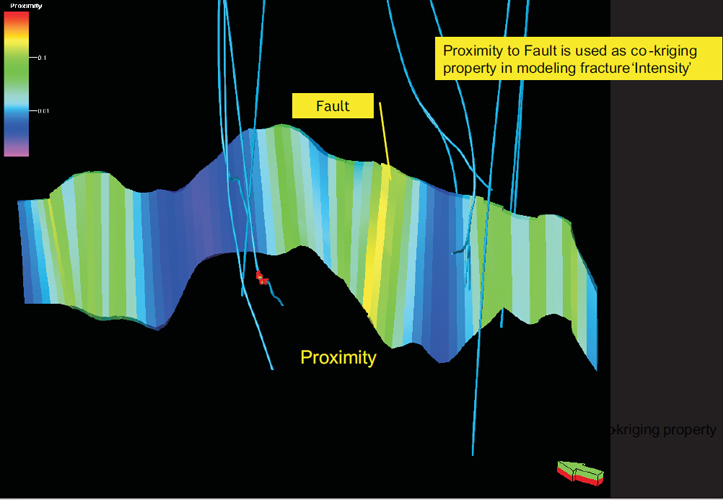
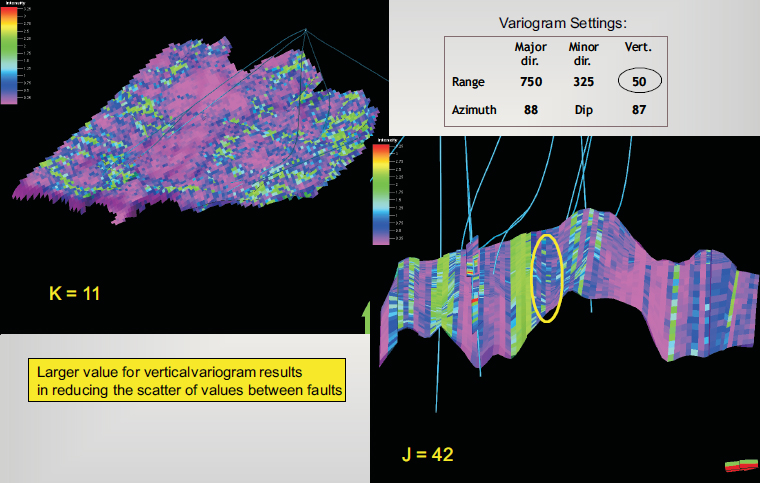
Fracture Model Workflow
(Figures 3-1, 3-2, 3-3, 3-4, 3-5, 3-6, 3-7, 3-8, 3-9, 3-10, 3-11, 3-12, and 3-13)

Figure 3-1. Core to FMI calibration in Dev-4BP well. Example of multilayer (throughgoing) fracture zones in core and corresponding image log response in the Dev-4BP well. The zone corresponds to either the “incipient” or “mature” fracture zones identified in the horizontal Polvo Gx well.

Figure 3-2. Fracture log summary.

Figure 3-3. Horizontal well FMI interpretation.

Figure 3-4. Fracture model input.

Figure 3-5. Defining the mechanical model.

Figure 3-6. Fault proximity for Co-Kriging.

Figure 3-7. Modeling intensity of Through-Set-1 EW.

Figure 3-8. DFN of throughgoing fractures with faults in Pol Gx.

Figure 3-9. DFN of bed-confined fractures at 3-Dev-7 well.

Figure 3-10. Quissama reservoir performance.

Figure 3-11. Reservoir compartmentalization.

Figure 3-12. EOS model and projection of estimated fluid properties (1).

Figure 3-13. EOS model and projection of estimated fluid properties (2).

Concluding Comments

  • It’s complicated and it “ain’t” easy.
  • Know and use all your basic data, including image logs, core, well logs, and seismic.
  • Data need to be calibrated across all scales; i.e., from core to image log to e-log to seismic.
  • Defining the different fracture sets and associated attributes (e.g., structural dip azimuth, fracture height, fracture length, etc.) is the basis for creating a deterministic DFN.
  • Defining aperture permeability transforms specific to fracture sets is a critical step in the modeling process, as aperture permeability is modeled in the 3D grid and sampled into the DFN’s.
  • There is a limited set of controls available in modeling fracture density, length, height, aperture, and aperture permeability. Consequently, this results in significant uncertainty.
  • Combining multiple DFN’s into one is only possible through natural net analysis.
  • EOS modeling allows projection of fluid properties, especially oil viscosity, to areas of the reservoir where no data are available.
  • Dual Permeability approach is needed to describe the capillary continuity that has been seen to impact production performances in the wells.

References

de Graciansky, P.C., J. Hardenbol, T. Jaquin, and P.R. Vail, eds., 1998, Mesozoic and Cenozoic Sequence Stratigraphy of European Basins: SEPM Special Publication Series no. 60, 786 p.

Guardado, L.R., L.A.P. Gamboa, and C.F. Lucchesi, 1989, Petroleum geology of the Campos Basin, a model for a producing Atlantic type basin, in J.D. Edwards and P.A. Santogrossi, eds., Divergent/Passive Margins: AAPG Memoir, v. 48, p. 3-80.

Lucia, F.J., 2007, Carbonate Reservoir Characterization An Integrated Approach (2nd edition): Springer-Verlag, Berlin Heidelberg, 366p.

Rangel, H.D., and A.Z.N. de Barros, 1993b, Estrati-grafia e evolu-e-strutural da rea Sul (adjacente ao Alto de Cabo Frio) da bacia de Campos: Annals of the 3rd Southeastern Geological Symposium, Rio de Janeiro, Brasil, p. 57-63.

Rangel, H.D., A.L. Soldan, C.E. da S. Pontes, R.S. de Souza, L.M. Arienti, R.P. Bedregal, A.Bender, N.C. Azambuja, J.C. Ferreira, and R. Jahnert, 1993a, Habitat do petrleo da Por de gua Rasa na Regi Central da Bacia de Campos, Petrobras/Depex/Cenpes: Internal Report, 58 p.

Vail, P.R., 1987, Seismic stratigraphy interpretation using sequence stratigraphy: Part 1: Seismic stratigraphy interpretation procedure, in A.W. Bally (ed.) Atlas of Seismic Stratigraphy: AAPG Studies in Geology 27, p. 1-10.

Vail, P.R., R.M. Mitchum, Jr., R.G. Todd, J.M. Widmier, S. Thompson, III, J.B. Sangree, J.N. Bubb, and W.G. Hatlelid, 1987, Seismic stratigraphy and global changes of sea level, in C.E. Payton, ed., Seismic Stratigraphy - Applications to Hydrocarbon Exploration: AAPG Memoir 26, p. 49-212.


Return to top.


Copyright © AAPG. Serial rights given by author. For all other rights contact author directly.