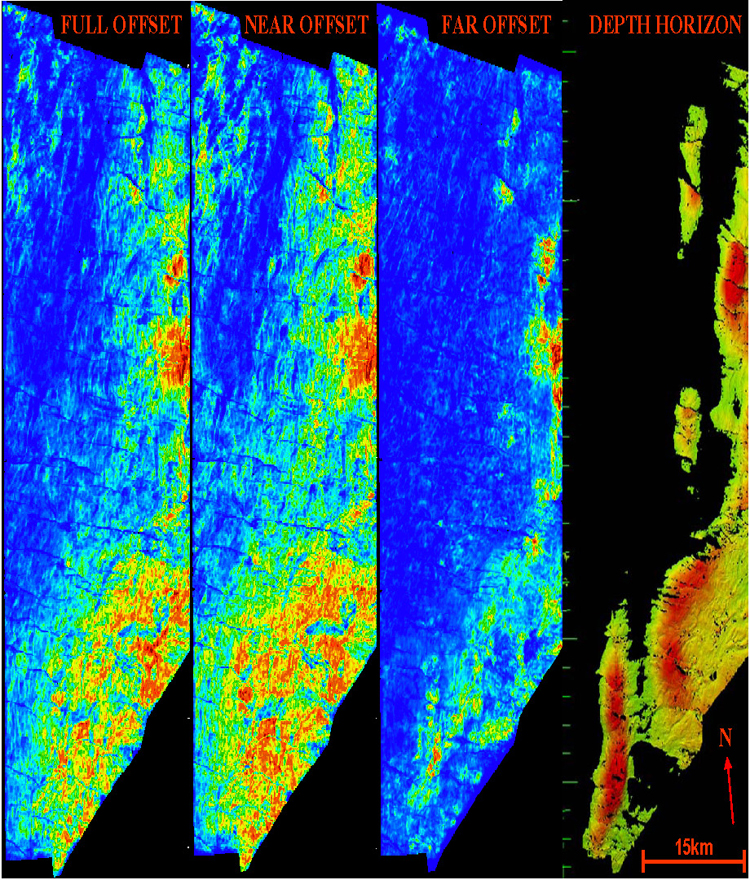
Figure 5. RMS amplitude maps extracted along the Base Messinian Evaporite horizon, with the corresponding depth map showing the highs to the right.
Figure 5. RMS amplitude maps extracted along the Base Messinian Evaporite horizon, with the corresponding depth map showing the highs to the right.