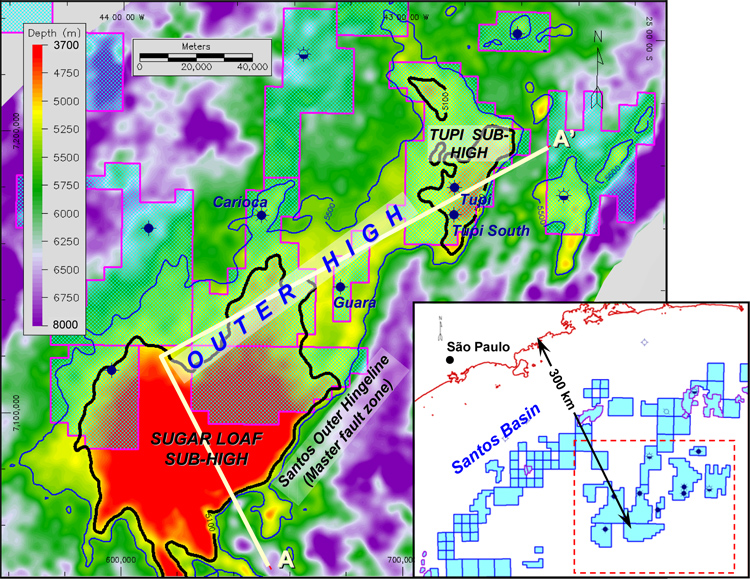
Figure 1. Base salt structural map of the Outer High of the Santos Basin (Aptian, c. 117 my), showing the pre-salt wells to date. Selected contours highlight the Outer High structure (blue contour, 5500 m) and the two individual culminations within the “mega-closure”, forming the “Tupi” and “Sugar Loaf” sub-highs (black contour, 5100 m). The mapped area represents the dotted red rectangle on the lower right figure. The seismic transect A-A’ is displayed on Figure 2.