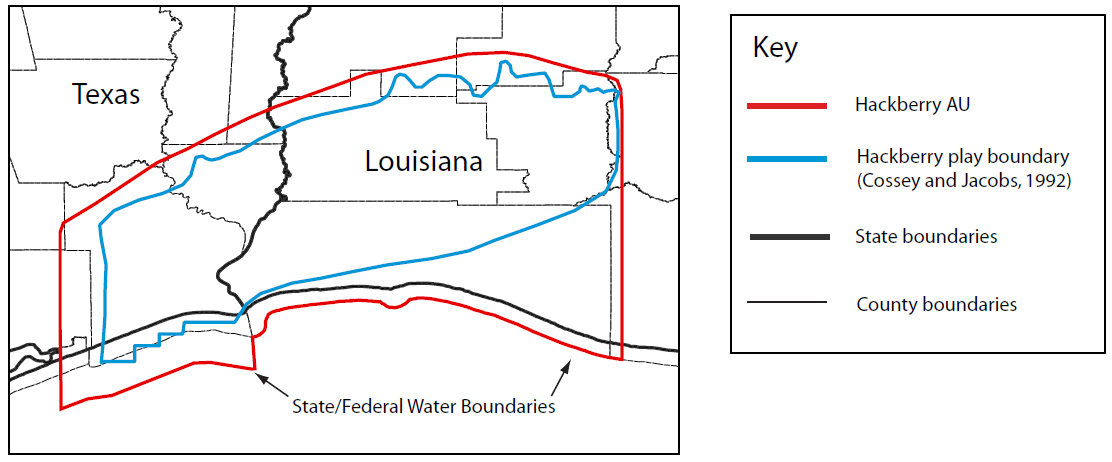
Figure 18. Map of southeast Texas and southwest Louisiana showing location of the Hackberry play and Hackberry Oil and Gas Assessment Unit. Northern limit of the play outline represents the Hackberry subcrop. The southern boundary of the play, as reported by Cossey and Jacobs (1991), was limited by drilling economics to where the base of the Hackberry Formation was at about 15,000 ft. The southern boundary for the Hackberry Oil and Gas Assessment Unit was extended to the State/Federal water boundary.