Click on image for enlargement.
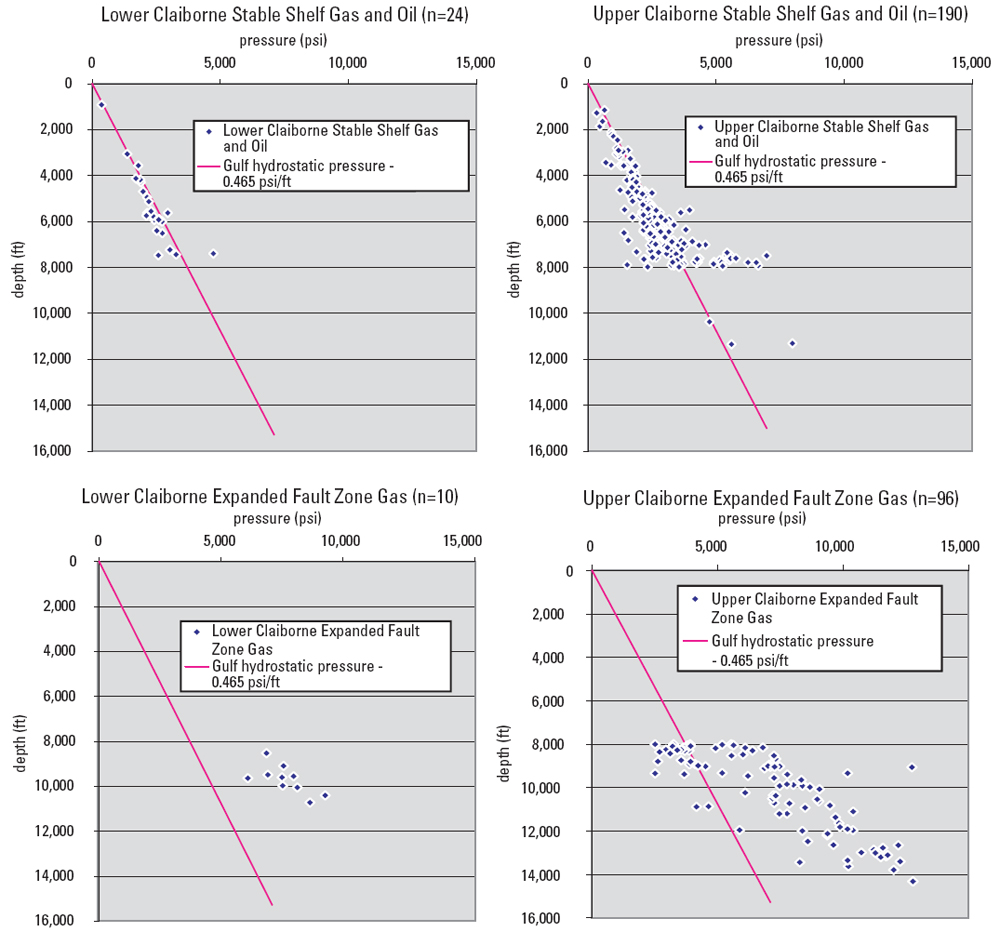
Figure 27. Plots of pressure as a function of depth for Claiborne reservoirs with pressure data (data from NRG Associates, 2006). Gulf hydrostatic pressure line from Dickinson (1953).
Click on image for enlargement.
Figure 27. Plots of pressure as a function of depth for Claiborne reservoirs with pressure data (data from NRG Associates, 2006). Gulf hydrostatic pressure line from Dickinson (1953).