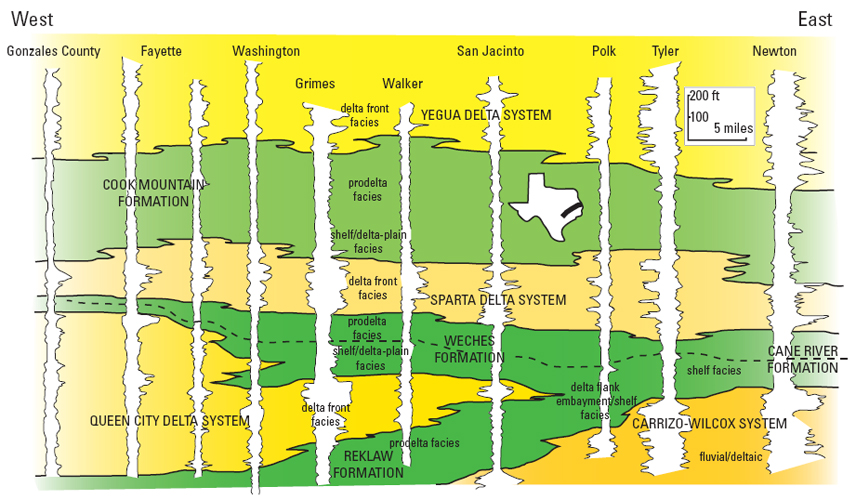
Figure 7. SP and resistivity log response of the Lower Claiborne section in eastern Texas illustrating eastward loss of the Queen City Sand. Dashed line illustrates division between prodelta and shelf/delta-plain facies. From Ricoy and Brown (1977); see Ricoy (1976) for original data.