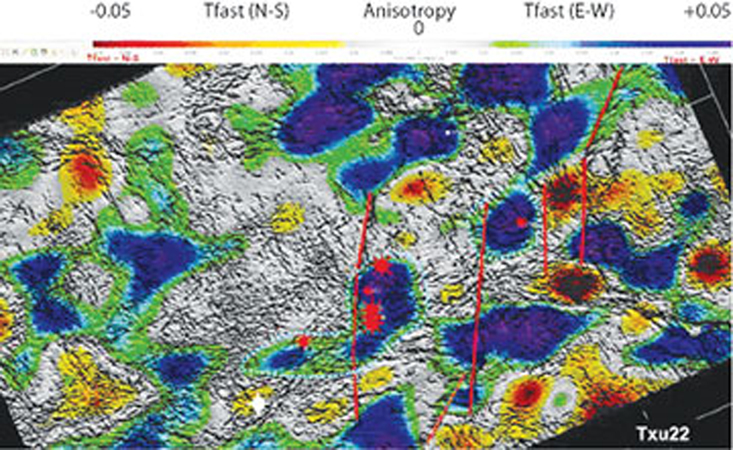
Figure 7. This display shows a combination of attributes including similarity, fracture orientation and density from shear-wave splitting, and small faulting. The size of the well symbols shows the relative production from the wells. The color bar is scaled to show anisotropy, with 0 being isotropic (gray), and gets more anisotropic in the east-west direction as it approaches +0.05 (colors go from light green to deep purple). The scale in the other direction toward -0.05 (colors go from yellow to deep red) indicate more anisotropy in the north-south direction.