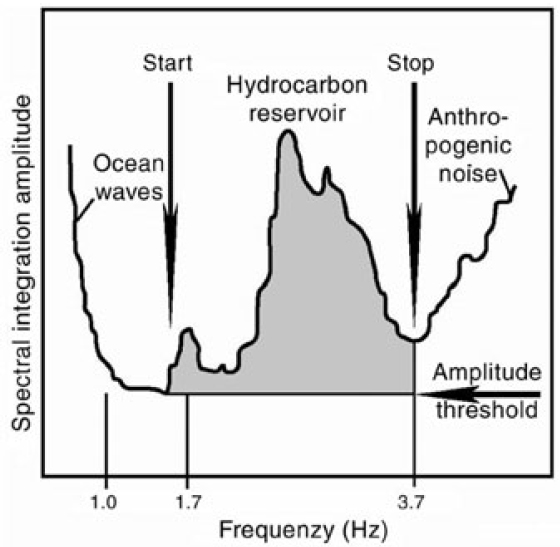
Figure 2. Integrating the frequency spectrum of natural-source seismic data emphasizes and smoothes any signal that appears in the interval between ocean-wave activity (less than 0.2 Hz) and anthropogenic (human) activity (greater than 4 Hz). Some requirements of the data analysis are to define the start and stop frequencies of interest and the amplitude threshold of signals that should be considered.