 Click to
view presentation in PDF format (without animations) (18 mb).
Click to
view presentation in PDF format (without animations) (18 mb).
Click on images to view animation files:
Slide 14
 (62mb);
Slide 16
 (659 mb);
Slide 31
 (180 mb);
Due to large file sizes, performance may be extremely slow; improve speed by downloading (right click and download) and playing file locally.
Plate Tectonic and Paleogeographic Mapping: State of the Art*
By
Christopher Scotese1
Search and Discovery Article #40312 (2008)
Posted July 22, 2008
*Adapted from oral presentation at AAPG Annual Convention, San Antonio, Texas, April 20-23, 2008
1Earth & Environmental Sciences, University of Texas at Arlington, Arlington, TX ([email protected])
How well do we know the configurations of the continents and ocean basins back through time? How accurate are our interpretations of long-eroded mountain ranges and ancient shallow seas? It has been over 40 years since the plate tectonic revolution; what have we learned? How much do we really know? Where should we be focusing our research efforts? Though there have been incremental improvements in our knowledge, the geological and geophysical datasets upon which these reconstructions are based have not changed much in nearly 20 years ago. There are less than a dozen research groups that produce global plate tectonic and paleogeographic reconstructions. Is there general agreement between these groups concerning plate positions and paleogeography through time? How do the interpretations of each of these groups differ? How do we quantify what we know and what we don’t know? Though unanswered questions remain, the advent of GIS technology (ArcGIS 9.2 from ESRI) has made it easier to gather the data needed to tackle the remaining questions. Plate tectonic and paleogeographic mapping is now an important tool that is helping the oil industry better understand the formation and development of hydrocarbon systems in frontier areas. Paleogeographic maps are the foundation upon which sophisticated climate models are being run to predict the spatial and temporal distribution of source rocks and reservoir rocks. The newest generation of paleogeographic maps include 3D digital elevation models (PaleoDEMs) that model past changes in bathymetry and topography. This talk will 1) present snap shots from the PaleoAtlas for ArcGIS, a compilation of 50 plate tectonic and paleogeographic reconstructions assembled by the PALEOMAP Project, and 2) will include a 3D computer animation that illustrates plate motions and paleogeographic changes during the last 750 million years.
|
|
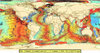
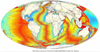
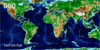
Data Used to Produce Plate Models · GPS & Earthquakes (Modern) · Ocean Floor Fabric (back to 160 Ma) · Magnetic Picks & LMA (back to 180 Ma) · Hot Spot Tracks (back to 200 Ma) · Paleomagnetic APW paths (back to 300 Ma) · Fossils & Biogeography (back to 600 Ma) · Single Paleomagnetic Poles (back to 1200 Ma) · Geologic and Tectonic Interpretation (~2400 Ma)
Primary Reference Scotese, C.R., 2006 PALEOMAP Project (http://www.scotese.com). |


