Click on A-A' to view Figure 2.
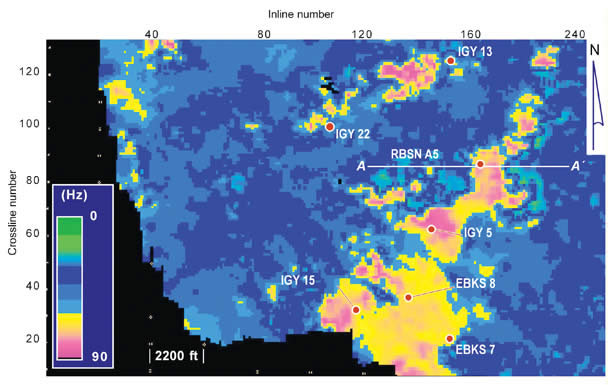
Figure 3. Map of average instantaneous frequency in a 10-ms window positioned 10 to 20 ms below the Caddo horizon. The trend of 60- to 75-Hz average-frequency attributes on this map is a close approximation to the log-based map in Figure 1 and identifies both new drilling locations and locations to avoid.