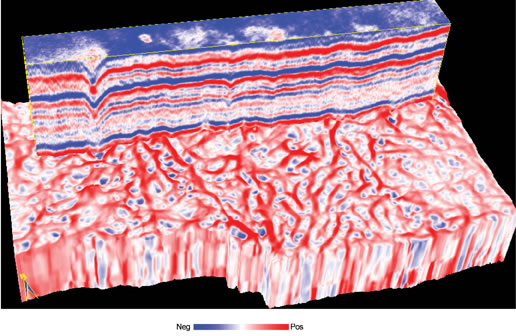
Figure 5. Strat-cube through most-positive curvature allows an interpreter to correlate features on the attribute with their corresponding seismic signature. We see that some of the channel edges on the most-positive curvature correlate with local “highs” on the seismic data. Channel thalwegs seen in Figure 4c correlate with local “lows” on the seismic data.