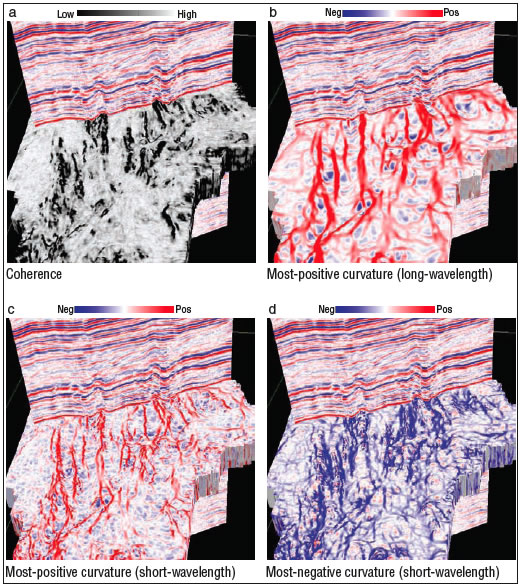
Figure 2. Zoom of chair-displays where the vertical display is a dip line through the 3-D seismic volume and the horizontal displays are time slices from (a) coherence, (b) most-positive (long-wavelength), (c) most-positive (short-wavelength), and (d) most-negative (short-wavelength) curvature attribute volumes. The fault lineaments correlate with the upthrown and downthrown signatures on the seismic.