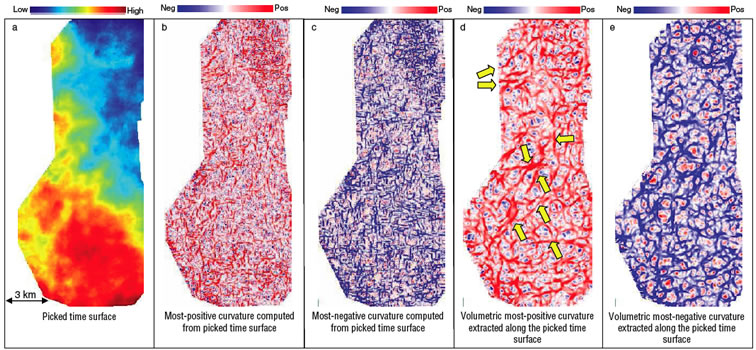
Figure 1. (a) Time surface from a 3-D seismic data volume from Alberta; (b) corresponding most-positive curvature; and (c) most-negative curvature computed from the picked horizon. Note the N-S and E-W-trending acquisition footprint. Horizon slices through volumetric calculations of (d) most-positive (long-wavelength) and (e) most-negative (long-wavelength) curvature. Block arrows indicate broad geologic flexures seen in the vertical seismic while the footprint artifacts seen on the horizon-based displays are not seen.