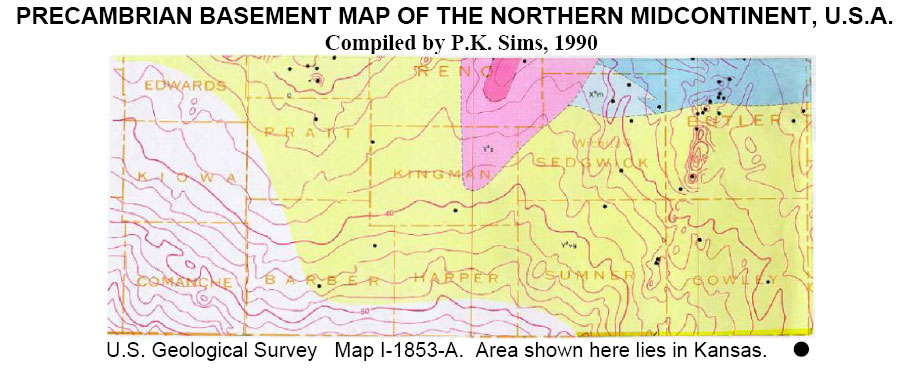
Figure 32. a. Standard USGS basement map of an 80 by 225 km area in southern Kansas (Sims, 1990) constructed from 35 irregularly distributed data points (black dots); that is, from basement rock types identified from oil well intercepts.
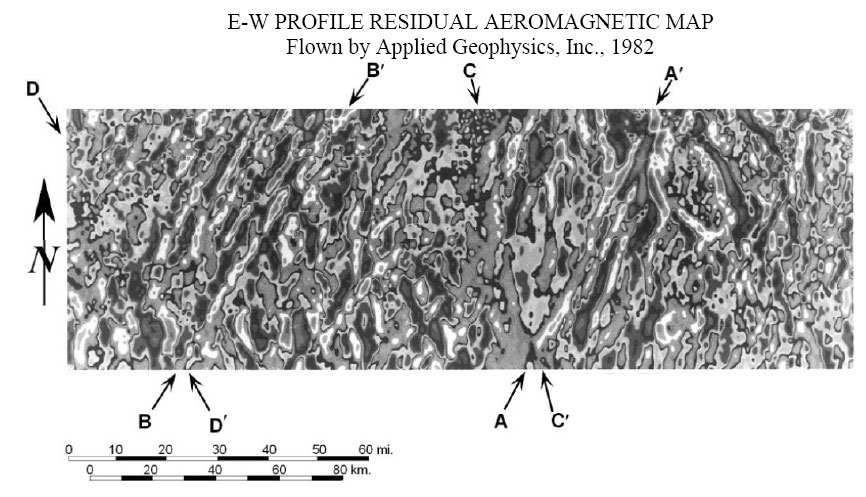
b. E-W profile residual aeromagnetic map of same area as in a., flown by Applied Geophysics, Inc., 1982. This map resulted from approximately 70,000 magnetic readings. Note the hundreds of linear anomalies, corresponding to basement fault blocks, the long through-going sutures, identified by letters, and the faulted oval-shaped intrusive (NE quadrant), all major geological features, none of which appear on the USGS map. I show these maps to illustrate why properly processed magnetic maps can be such a tremendous aid in studying and understanding regional geology.