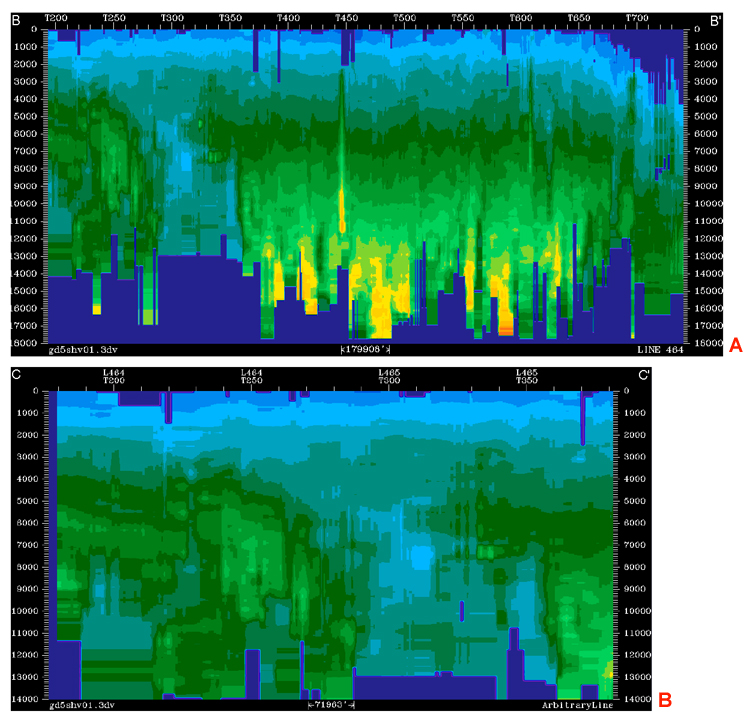
Figure 5: Sections showing shale P-wave velocity. (a) Texas to Florida (B-B’). (b) Texas to Louisiana (C-C’). Vertical scale in feet below sea floor.
Figure 5: Sections showing shale P-wave velocity. (a) Texas to Florida (B-B’). (b) Texas to Louisiana (C-C’). Vertical scale in feet below sea floor.