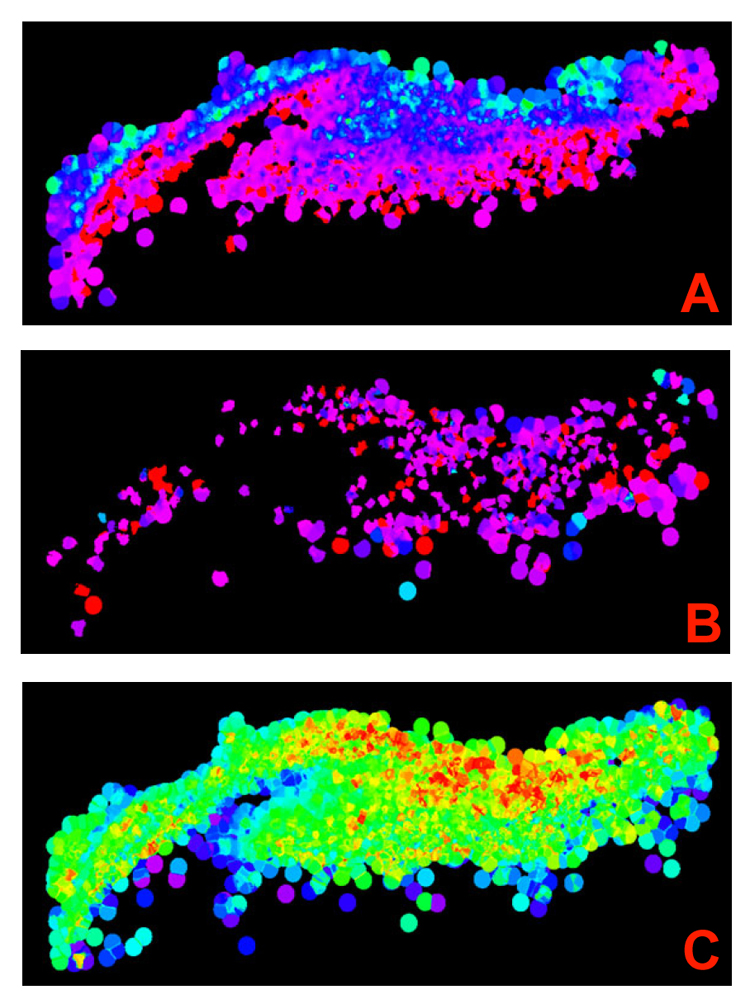
Figure 2: Sand-shale ratio at 5000 ft (1525 m) (a) and 15,000 ft (4570 m) (b); number of sand samples per trace (c). In (a) and (b), 50% sand is green and 0% sand is magenta and red. The gaps in the volume increase with depth. This is partly explained by the total number of sand samples per trace, shown in (c), in which largest values are red; smallest are blue.