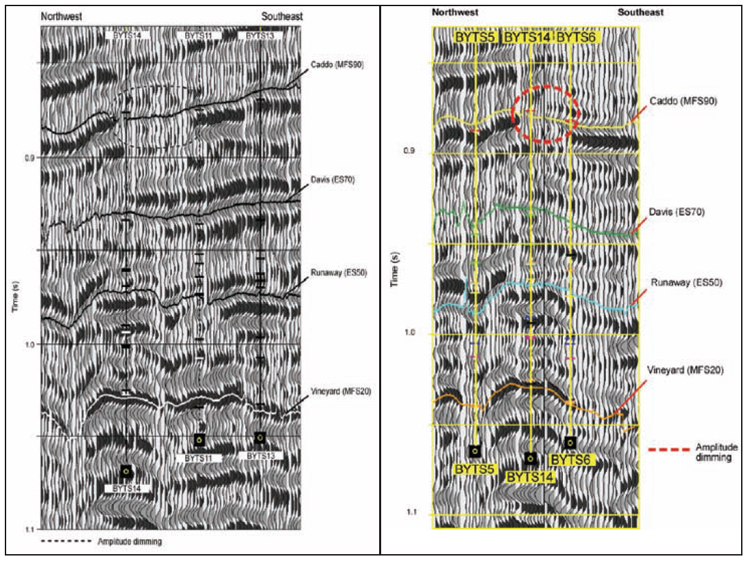
Figure 2. Seismic sections along Profile AA’ (left) and Profile BB’ (right) shown on the map in Figure 1. The top of the Caddo interval is identified on each profile. The circled area on each section shows where the sandstone trend crosses the line of profile.