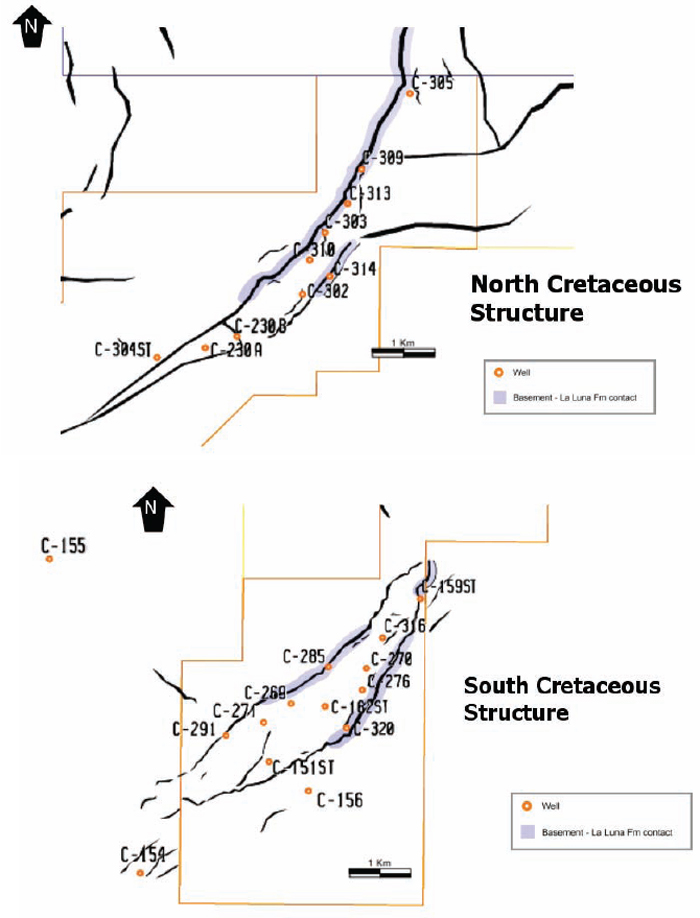
Figure 10-2. Maps of North Cretaceous and South Cretaceous structures. Production rate of wells is dependent on the number of intersected fractures. Colored areas indicate where basement is in fault—and direct contact with Cretaceous section.
Figure 10-2. Maps of North Cretaceous and South Cretaceous structures. Production rate of wells is dependent on the number of intersected fractures. Colored areas indicate where basement is in fault—and direct contact with Cretaceous section.