Click to view presentation in PDF format (~2.7 mb).
Update on Regional Assessment of Gas Potential in the Devonian Marcellus and Ordovician Utica Shales of New York*
By
Richard Nyahay1, James Leone1, and Langhorne B. Smith1, J.P. Martin2, and D.J. Jarvie3
Search and Discovery Article #10136 (2007)
Posted October 1, 2007
*Adapted from presentation at 2007 AAPG Eastern Section Meeting, September 16-18, Lexington, Kentucky
1Reservoir Characterization Group, New York State Museum, Albany, NY ([email protected])
2New York State Energy Research and Development Authority, Albany, NY
3Humble Geochemical Services, Humble, TX
There are at least two potential gas shale plays in New York in the Devonian Marcellus and the Ordovician Utica. A program was initiated to try to characterize both organic rich shales geochemically in New York. To date we have sampled 15 outcrops, 70 wells with well cuttings, and five cores from over 15 counties for our geochemical database. New isopach and structure contour maps have been constructed along with TOC, transformation ratio, and hydrogen index maps. These maps will help define fairways to explore.
Preliminary results show that the Utica has TOC values between 1.5 to 3 percent. The Devonian Marcellus Shale has TOC values between 0.3 and 11 percent. The Utica is a Type III to Type IV kerogen, while the Marcellus is a Type II to Type III kerogen. Fractures are being characterized in outcrop to see what orientations exist to determine the stress field at the time of deposition. XRD data is being run on some samples to determine mineralogy. Samples will also be examined with an SEM to determine if there is any microporosity. All work will be summarized in a final report that will include a database, cross sections, and defined fairways.
The Marcellus may be more favorable to newer completion techniques because of the high-silica Stony Hollow member that overlies the more organic rich Union Springs member. The Utica might have zones of higher porosity at a reasonable depth to create pore pressure in the quartz rich units of the Indian Castle and Dolgeville.
|
|
Assessing Unconventional Shale Gas Plays in New York · Identify high gas potential fairways using same geochemical methods applied to the Barnett and other successful shale gas plays. · These include TOC, vitrinite reflectance, hydrogen index and transformation ratios. · Create new structure and isopach maps of shale formations and potential gas producing intervals.
Ordovician Utica Shale Selected Figures (1-10)
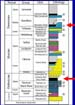
Flat Creek Member · Lowermost member of the Utica Formation. · K-bentonites and graptolites used to match key successions (Goldman et al., 1994). · Dark gray to black, variably calcareous shale with minor thin beds of argillaceous micrite and biomicrite (Lehmann et al. 1995). · Bounded by Dolgeville member on top.
Dolgeville Member · Interpreted as a slope facies peripheral to the Trenton platform. · Tabular ribbon limestones and dark gray to black shale beds. · Several geochemically correlated K –bentonites. · Bounded on top by Thruway unconformity. · Slump folds occur immediately below the unconformity. · Folds are dominantly asymmetrical with a westward vergence.
Indian Castle Member · Uppermost member of the Utica Formation blankets all of western NY. · Thin layers of fossil debris, phosphatic debris and quartz. · Condensed beds. · K-bentonites used to match key successions. Sharp contact with underlying Steuben limestone, more subtle contact where it overlies Dolgeville. · Divided into the lower and upper sections (Baird and Brett, 2002).
Geochemical Study and Gas Production · Using geochemistry in an attempt to define a general fairways for exploration in Utica and Marcellus. · Using the same Rock-Eval approach Jarvie et al (2005) used for the Barnett Shale. · Used cuttings from 31 wells and samples from 12 cores, 5 outcrops.
· Gas production from tight shales requires maturation and cracking of oil that has been generated from live organic matter -need to have at least 2 percent TOC to begin with. · With increasing maturation carbon and hydrogen are lost from shale due to hydrocarbon generation. · Increasing thermal maturity therefore leads to decrease in TOC and hydrogen values. · Want shales with decent original TOC, with evidence that significant amounts of gas has formed from that TOC during thermal maturation.
· TOC = Total organic carbon (%). · Live carbon including S1 (oil and gas present in shale) and S2 (remaining kerogen). · Tmax= The temperature at peak evolution of S2 hydrocarbons from Rock Eval. · Ro% = Vitrinite Reflectance (calculated from Tmax). · HI= Hydrogen Index (S2 x 100)/ TOC · TR= Transformation or conversion ratio calculated from hydrogen index (HI)
Geochemical TOC Data · Indian Castle < .5% · Dolgeville .5 -1.5% · Flat Creek 1.5 -3%
In Jarvie et al., 2005 study, TOC from cuttings were 2.36 times lower than samples from core; therefore this same dilution effect would be seen in other geochemical parameters.
Productive shales are generally >2% TOC.
Utica Tmax and Vitrinite reflectance (Ro) · Tmax is the temperature where S2 peaks. · Because >95% of the S2values in the Utica are too low and/or < S1, the Tmax values are unreliable in the Utica Shale. · Tmax can be used in some cases to obtain a calculated value for vitirinite reflectance (Ro) by the formula Ro=0.0180*Tmax-7.16. · Because Tmax is unreliable in the Utica, it is not possible to calculate reliable values for Ro.
· Hydrogen Index (HI) is a calculation to determine the amount of hydrogen remaining in the shale. · HI = (S2*100)/TOC. · HI decreases as thermal maturity increases because S2 goes down. · Again, S2 is uniformly very, very low in Utica so the HI values largely driven by TOC – · Lower values are generally thought to be better in Utica as they represent higher original TOC
· Evaluates the conversion directly by measuring changes in the kerogen (organic matter) yields. · In order to calculate this ratio, you need the present day Hydrogen index (HIpd) and original Hydrogen index (HIo) (see Jarvie et al., 2007 for formula). · Areas with highest potential for production have values approaching 1, lower values = lower potential.
Selected Figures (Figures 11-22)
· Organic-rich thinly bedded blackish grey to black shale with thin silt bands. · The member is between the Cherry Valley and Onondaga Limestone. · Characterized as pyritiferous; farther east the Union Springs becomes the Bakoven Member that becomes darker, less organic and has few limestone members. · Lenses in and out in localities in far Western New York.
Cherry Valley Member · Consists of skeletal limestones and shaly intervals. · Westward thinning of the Marcellus Formation in western and central New York leads to the condensation and union of the Cherry Valley limestones with limestones in the upper part of the Union Springs.
· Upper member of the Marcellus Formation in Western and central New York. · Becomes Cardiff and Chittenango members in Central and Eastern New York. · Is confined in Western New York by Stafford and Onondaga limestones. · Farther east it is between the Stafford and Cherry Valley limestones where it is present. · Dark grey to black organic-rich shale.
Vitrinite Reflectance Calculation · Vitrinite refelctance(Ro) is a measure of thermal maturity that can be done directly on plant matter. · Ro can be estimated from reliable Tmax data using the following calculation. · Ro(%)=(0.0180*Tmax)-7.16. · The Tmax data in the Marcellus is much better than the Utica –about half the points have useable S2 values.
Vitrinite Reflectance (Ro%) (based on Jarvie et al, 2005
Well Cuttings Core •Low maturity source rocks 0.0 –0.55% •Low maturity source rocks 0.0 -0.55% •Oil window 0.55% -1.0% •Oil window 0.55%-1.15% •Condensate-wet gas window 1.0 %-1.40% •Condensate–wet gas window 1.15%-1.40% •Dry gas window > 1.40% •Dry gas window > 1.40 %
Comments on Marcellus · Some wells, such as the Beaver Meadows well, were drilled in what is the geochemical fairway for Marcellus but were not completed and are assumed to be dry holes. Why? · Other aspects may be equally important: –completion/frac practices need to be refined. –may need certain silica content. –too much TOC? –Overcooked? · More work is needed
· Calculate and make maps of original TOC, S2 and HI. · Get analysis of gas samples from newer wells whenever possible. · Get mineralogy data for shales. · Resample areas where data is questionable or missing and test conclusions with new samples in fairways. · See what happens with newer wells in fairways that have new drilling/completion/frac concepts.
Conclusions (Figure 23)
· The Marcellus and Utica Shales both contain fairways that are favorable to gas exploration based on geochemical data. · Both fairways occur in overlapping areas in the eastern Southern Tier of the State where there are not many wells drilled to date. · Wells with good shows occur in predicted fairways. · Within the Utica Shale, the Flat Creek and, to a lesser extent, Dolgeville members, which both thicken to the east and pinch out to the west, have the best potential. · In the Marcellus Shale, the Oatka Creek and Union Springs members have the best potential. · The Marcellus is organically richer than the Utica.
· John Martin for NYSERDA financial support · Fortuna Energy · EOG Resources · Jay Leonard of Platte River Associates for geochemical data on easternmost Utica well cuttings
Baird, G.C., and C.E. Brett, 2002 Indian Castle Shale: late synorogenic siliciclastic succession in an evolving Middle to Late Ordovician foreland basin, eastern New York State: Physics and Chemistry of the Earth, Parts A/B/C, v. 27, no. 1, p. 203-230.Goldman, D., C.E. Mitche.., Stig. M. Bergstrom J.W. Delano, and S. Tice, 1994, K-Bentonites and Graptolite Biostratigraphy in the Middle Ordovician of New York State and Quebec: A New Chronostratigraphic Model: Palaios, v. 9, no. 2, p. 12-143.Jarvie, D.M., 1991, Total organic carbon (TOC) analysis, in R.K. Merrill, ed., Treatise of petroleum geology: Handbook of petroleum geology, source and migration processes and evaluation techniques: AAPG, p. 113-118. Jarvie, D.M., R.J. Hill, and R.M. Pollastro, 2005, Assessment of the gas potential and yields from shales: The Barnett Shale model, in B.J. Cardott, ed., Unconventional energy resources in the southern Mid-continent, 2004 symposium: Oklahoma Geological Survey Circular 110, p. 37-50. Jarvis, D.M., R.J. Hill, T.E. Ruble, and R.M. Pollastro, 2007, Unconventional shale-gas systems: The Mississippian Barnett Shale of north-central Texas as one model for thermogenic shale-gas assessment: AAPG Bulletin, v. 91, p. 475-499. Lehmann et al. 1995 |